6-11
I Graphing Statistical Calculation Results
While the parameter calculation result is on the display, you can graph the displayed
regression formula by pressing (DRAW).
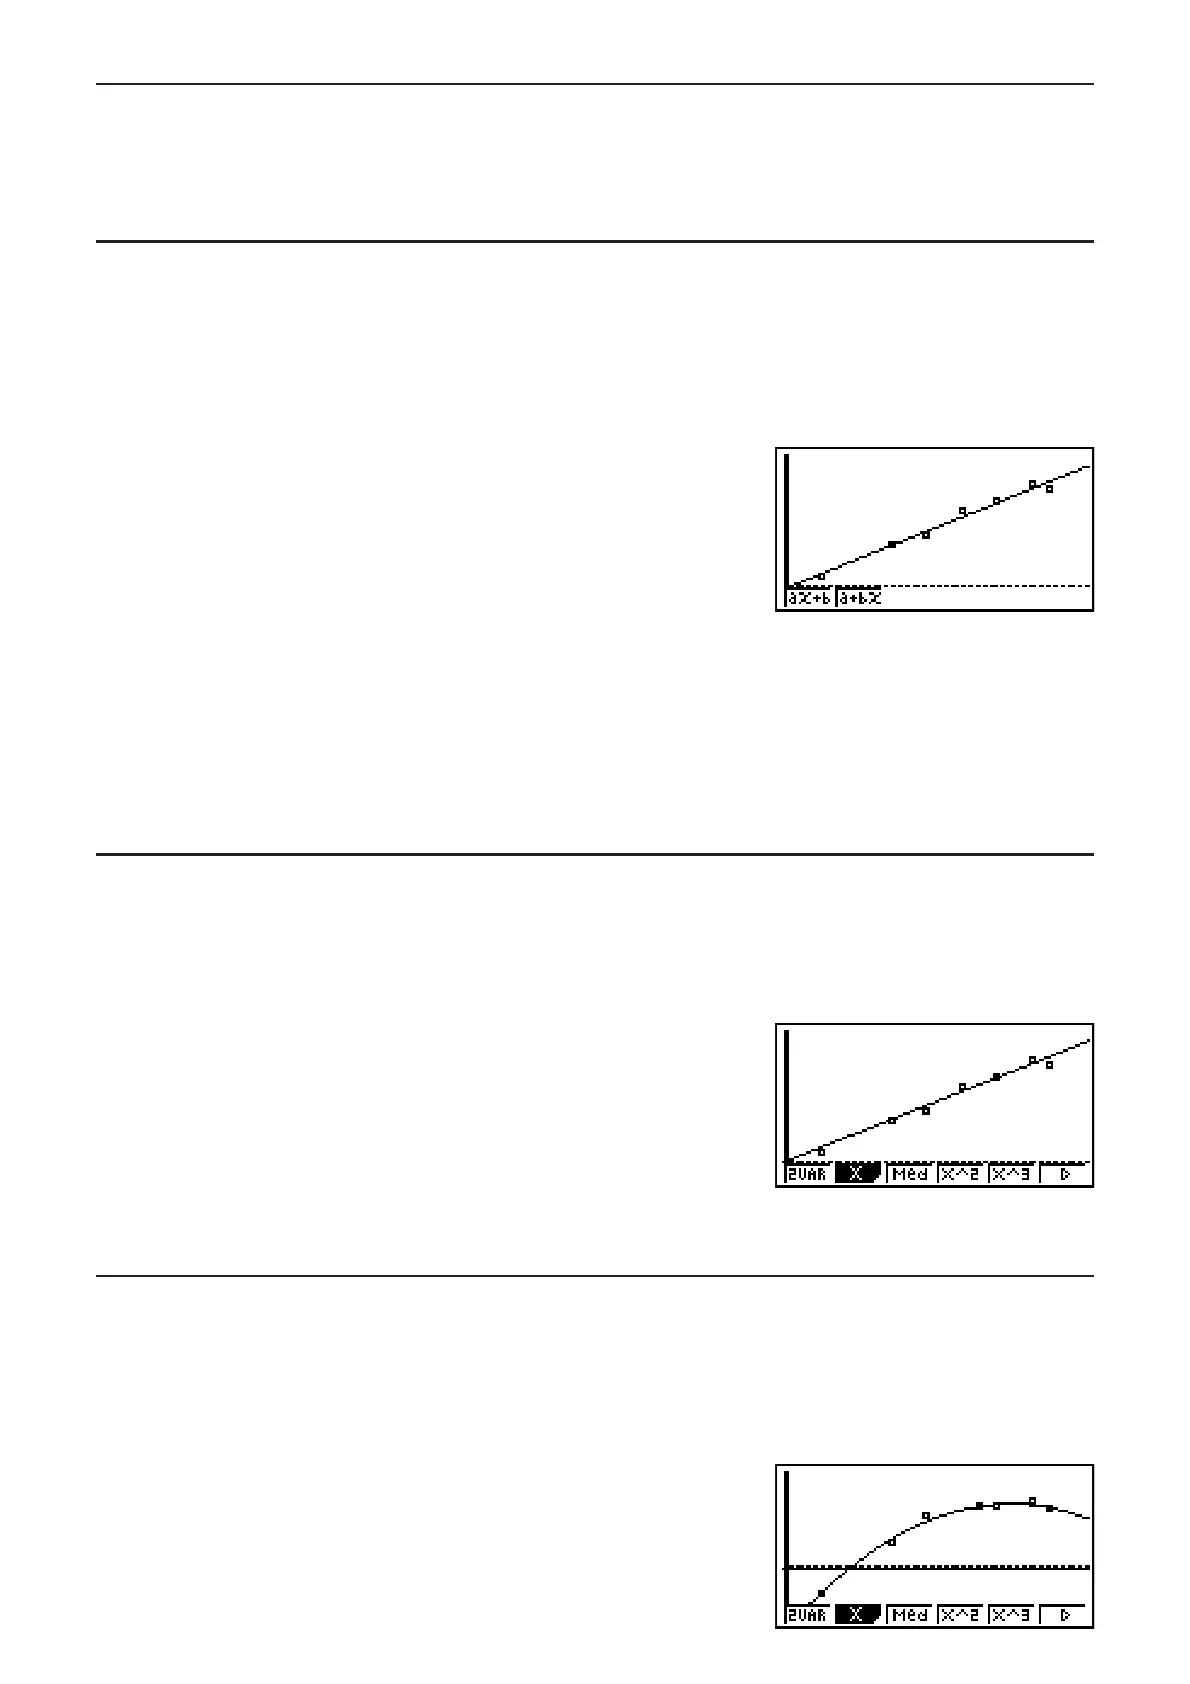
I Linear Regression Graph
Linear regression uses the method of least squares to plot a straight line that passes close to
as many data points as possible, and returns values for the slope and
y-intercept (y-coordinate
when
x = 0) of the line.
The graphic representation of this relationship is a linear regression graph.
(CALC)(X)
(
ax+b) or (a+bx)
(DRAW)
The following is the linear regression model formula.
y = ax + b
a
.............regression coefficient (slope)
b.............regression constant term (y-intercept)
y = a + bx
a
.............regression constant term (y-intercept)
b.............regression coefficient (slope)
I Med-Med Graph
When it is suspected that there are a number of extreme values, a Med-Med graph can be
used in place of the least squares method. This is similar to linear regression, but it minimizes
the effects of extreme values.
(CALC)(Med)
(DRAW)
The following is the Med-Med graph model formula.
y = ax + b
a
..............Med-Med graph slope
b..............Med-Med graph y-intercept
I Quadratic/Cubic/Quartic Regression Graph
A quadratic/cubic/quartic regression graph represents connection of the data points of a
scatter diagram. It uses the method of least squares to draw a curve that passes close to
as many data points as possible. The formula that represents this is quadratic/cubic/quartic
regression.
Ex. Quadratic regression
(CALC)(X^2)
(DRAW)

 Loading...


