6-14
While the statistical data list is on the display, recall the Setup screen to specify a LIST (“List 1”
through “List 26”) for “Resid List”. Calculated residual data is stored in the specified list.
The vertical distance from the plots to the regression model will be stored in the list.
Plots that are higher than the regression model are positive, while those that are lower are
negative.
Residual calculation can be performed and saved for all regression models.
Any data already existing in the selected list is cleared. The residual of each plot is stored in
the same precedence as the data used as the model.
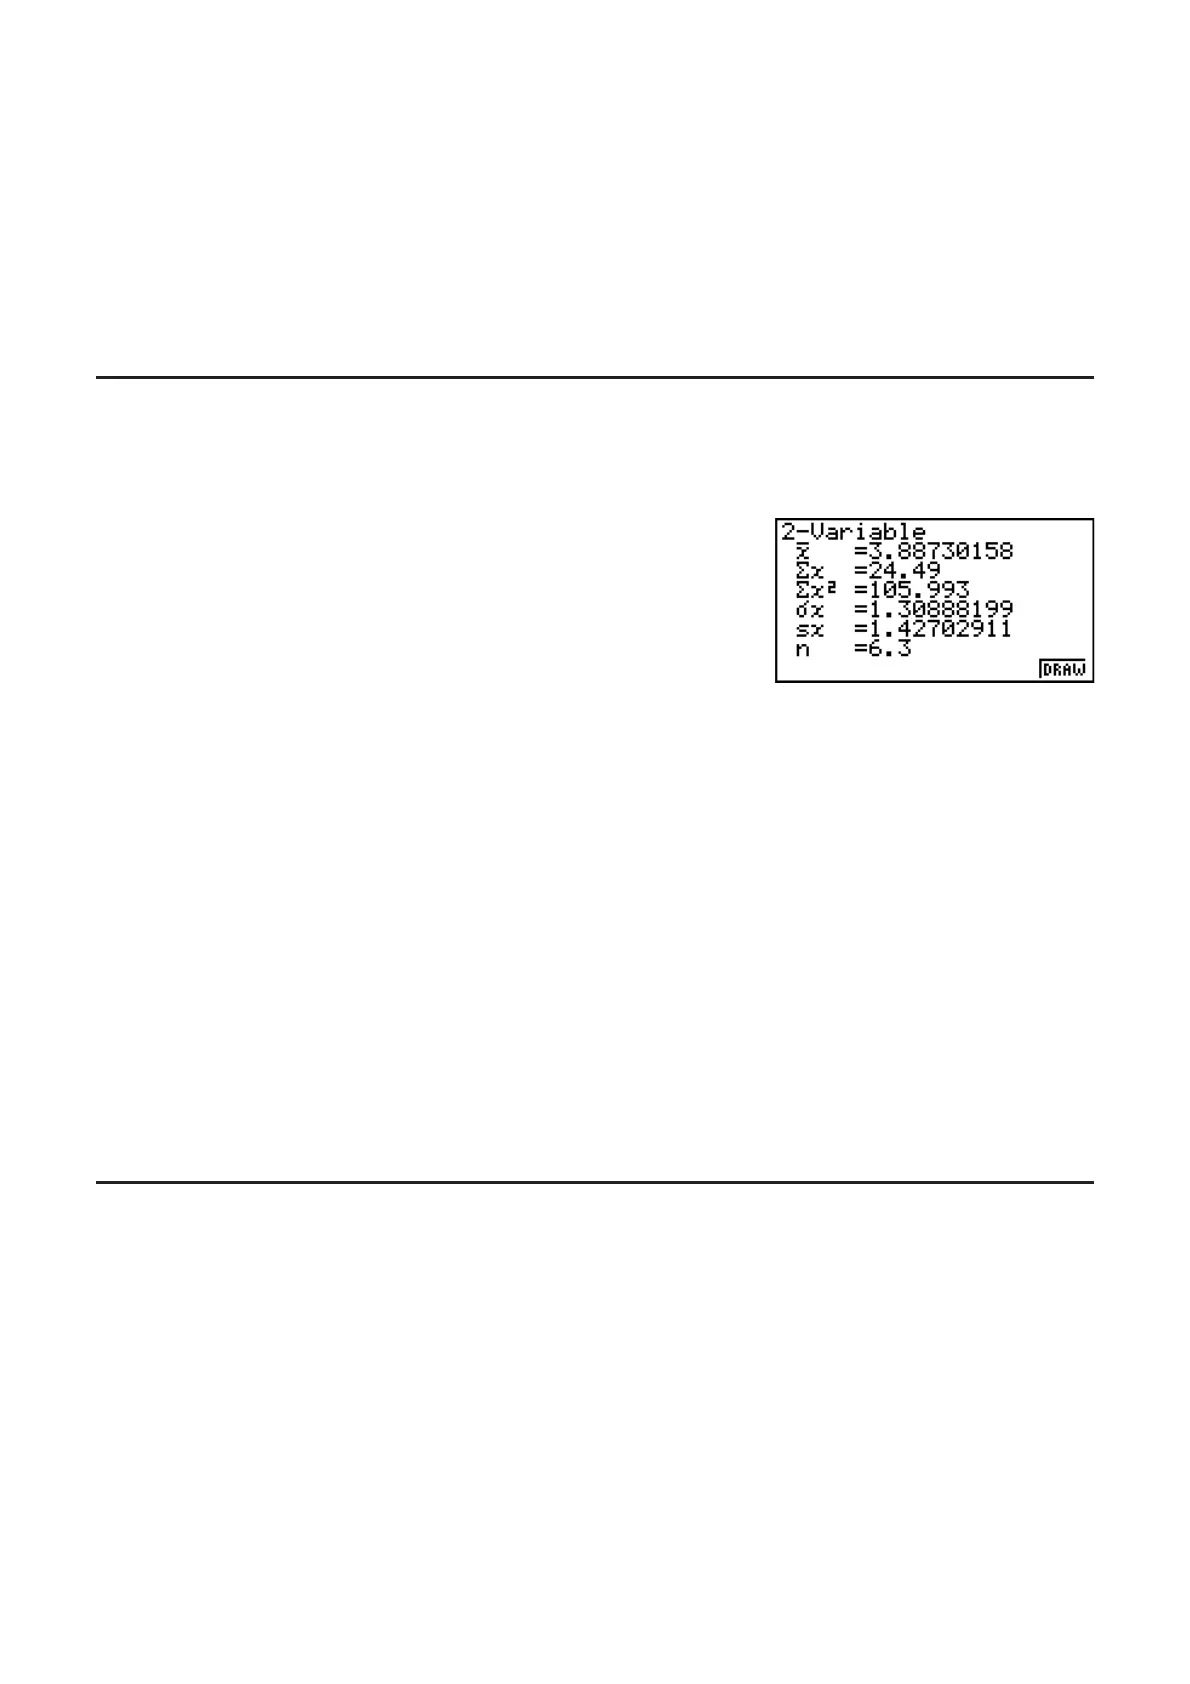
I Displaying the Calculation Results of a Drawn Paired-Variable Graph
Paired-variable statistics can be expressed as both graphs and parameter values. When these
graphs are displayed, the paired-variable calculation results appear as shown below when you
press (CALC)(2VAR).
• Use A to scroll the list so you can view the items that run off the bottom of the screen.
M ........... mean of data stored in
xList
3
x ......... sum of data stored in xList
3
x
2
........sum of squares of data stored in
xList
S
x
..........population standard deviation of
data stored in xList
s
x
..........sample standard deviation of
data stored in xList
n ........... number of data
N ............mean of data stored in
yList
3
y ......... sum of data stored in yList
3y
2
........ sum of squares of data stored in yList
S
y
.......... population standard deviation of data
stored in yList
s
y
.......... sample standard deviation of data
stored in yList
3
xy ........ sum of the product of data stored in
xList and yList
minX...... minimum of data stored in
xList
maxX..... maximum of data stored in
xList
minY...... minimum of data stored in
yList
maxY..... maximum of data stored in
yList
I Copying a Regression Graph Formula to the GRAPH Mode
You can copy regression formula calculation results to the GRAPH mode Graph relation list,
and store and compare.
1. While a regression calculation result is on the display (see “Displaying Regression
Calculation Results” on page 6-10), press (COPY).
• This will display the GRAPH mode Graph relation list.*
1
2. Use D and A to highlight the area to which you want to copy the regression formula of
the displayed result.
3. Press U to save the copied graph formula and return to the previous regression calculation
result display.
*
1
You cannot edit regression formulas for graph formulas in the GRAPH mode.

 Loading...


