9-16
I Example of Statistical Graph Operations (GRPH Menu)
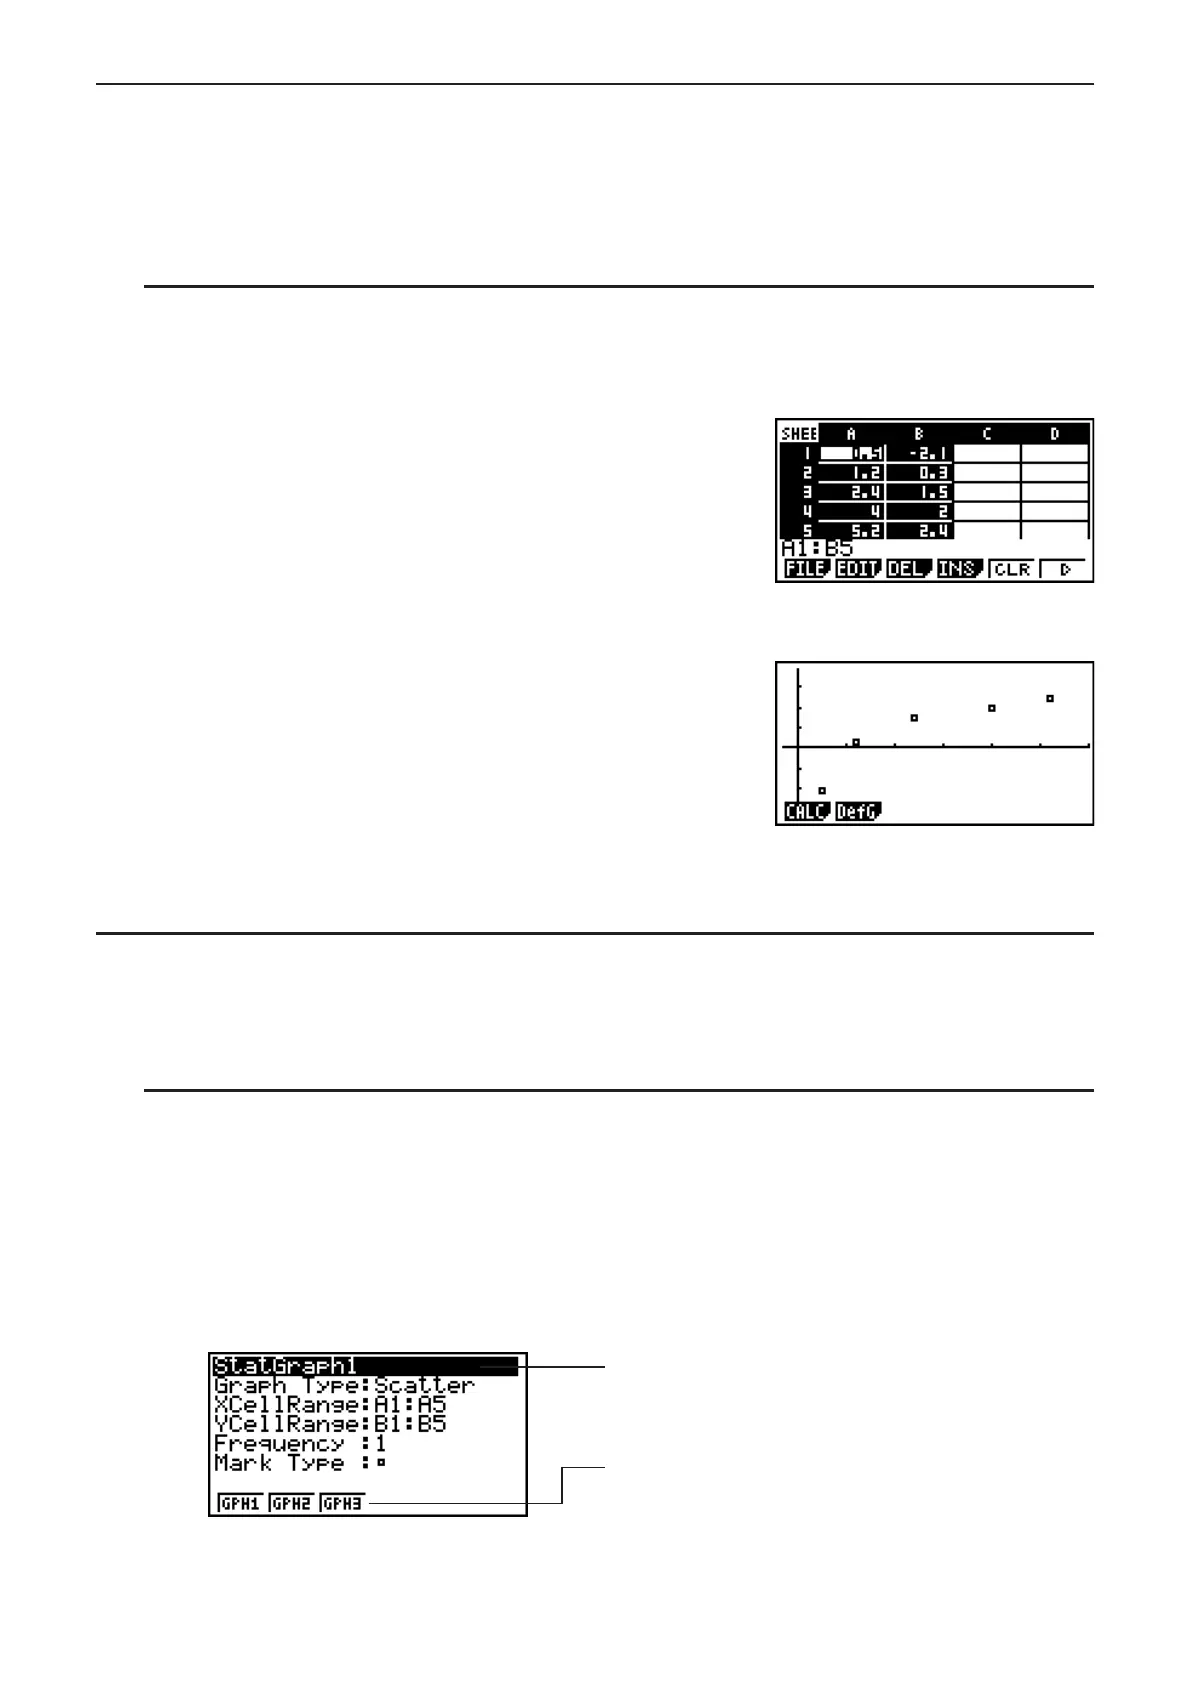
Input the following data and draw a statistical graph (scatter plot in this example).
0.5, 1.2, 2.4, 4.0, 5.2 (
x-axis data)
–2.1, 0.3, 1.5, 2.0, 2.4 (
y-axis data)
S To input data and draw a statistical graph (scatter plot)
1. Input the statistical calculation data into the spreadsheet.
• Here we will input the
x-axis data into column A, and the y-axis data into column B.
2. Select the range of cells you want to graph (A1:B5).
3. Press (E)(GRPH) to display the GRPH menu, and then press (GRPH1).
• This will produce a scatter plot of the data in the range
of cells you selected in step 2 of this procedure.
• The graph shown here is what is produced under
initial default S
•
SHT mode settings. You can change
the configuration of graph settings on the screen that
appears when you press (SET) on the GRPH
menu. For details see “General Graph Settings Screen
Operations” below.
I General Graph Settings Screen Operations
You can use the general graph setting screen to specify the range of data to be used for
graphing, and to select the type of graph to be drawn.
S To configure statistical graph settings
1. Input the statistical calculation data into the spreadsheet and then select the range of cells
you want to graph.
• Actually, the above step is not necessary at this point. You also could configure settings
first before inputting data and selecting the range of cells to be graphed.
2. Press (E)(GRPH)(SET).
• This will display the general graph settings screen (StatGraph1 in this example).
You can configure the setting for the item that is
highlighted on the screen.
A function menu will appear when certain
setting items are selected.

 Loading...


