Chapter 3: Graph & Table Application 104
To do this on the Graph window: Do this:
Automatically configure settings so the Graph screen fills the entire
screen in accordance with the graph being drawn
Tap [Zoom] and then [Auto], or
tap R.
Return a graph to its original View Window settings Tap [Zoom] and then [Original].
Adjust View Window
x-axis values so that they are identical to the y-axis
values
Tap [Zoom] and then [Square].
Round View Window settings (
xmin, xmax, xdot) to an appropriate
number of decimal places and redraw the graph
Tap [Zoom] and then [Round].
Make the value of each dot equal 1, which makes all coordinate values
integers
Tap [Zoom] and then [Integer].
Return View Window parameters to their settings prior to the last zoom
operation
Tap [Zoom] and then [Previous].
Return View Window parameters to their initial default (see “Initial
(Default)” under “View Window Preset Parameters” on page 102)
Tap [Zoom] and then [Initialize].
Redraw graphs using preset View Window parameter values See “Using Quick Zoom” below.
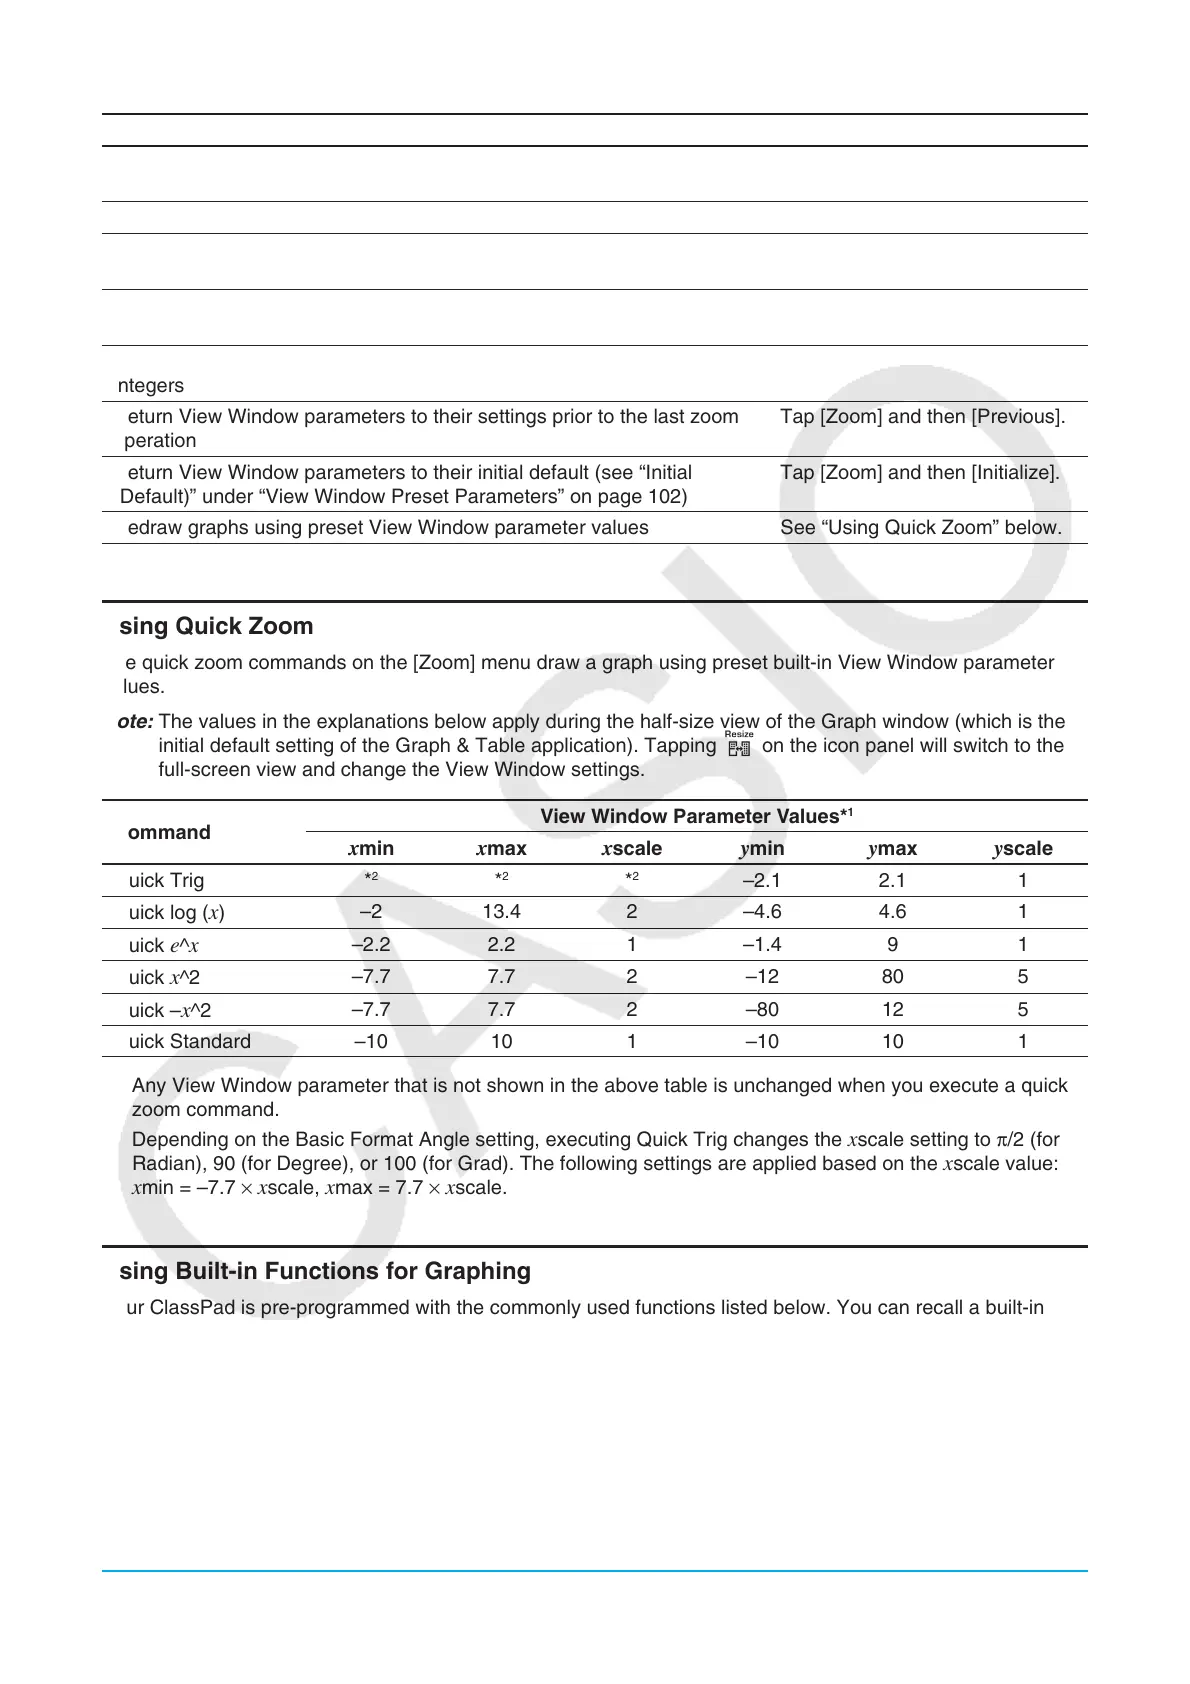
Using Quick Zoom
The quick zoom commands on the [Zoom] menu draw a graph using preset built-in View Window parameter
values.
Note: The values in the explanations below apply during the half-size view of the Graph window (which is the
initial default setting of the Graph & Table application). Tapping r on the icon panel will switch to the
full-screen view and change the View Window settings.
Command
View Window Parameter Values*
1
xmin xmax xscale ymin ymax yscale
Quick Trig *
2
*
2
*
2
–2.1 2.1 1
Quick log (
x)
–2 13.4 2 –4.6 4.6 1
Quick
e^x
–2.2 2.2 1 –1.4 9 1
Quick x^2
–7.7 7.7 2 –12 80 5
Quick –
x^2
–7.7 7.7 2 –80 12 5
Quick Standard –10 10 1 –10 10 1
*1 Any View Window parameter that is not shown in the above table is unchanged when you execute a quick
zoom command.
*2 Depending on the Basic Format Angle setting, executing Quick Trig changes the
xscale setting to π/2 (for
Radian), 90 (for Degree), or 100 (for Grad). The following settings are applied based on the xscale value:
xmin = –7.7 × xscale, xmax = 7.7 × xscale.
Using Built-in Functions for Graphing
Your ClassPad is pre-programmed with the commonly used functions listed below. You can recall a built-in
function, assign values to its coefficients, and graph the results.
y = aⴢx + by = aⴢcos (bⴢx + c) + dy = aⴢe^(bⴢx + c) + d
y
= aⴢx^2 + bⴢx + cy = aⴢtan (bⴢx + c) + dy = a^(bⴢx + c) + d
y
= aⴢx^3 + bⴢx^2 + cⴢx + dy = aⴢlog (bⴢx + c) + dy = a /(bⴢx + c) + d
y
= aⴢsin (bⴢx + c) + dy = aⴢln (bⴢx + c) + d
Note: Built-in functions are graphed automatically and cannot be used for input on the Graph Editor window.