Chapter 7: Statistics Application 148
Input and Output Terms
kInput Terms
C-Level: confidence level (0 s C-Level < 1)
Contrib: name of list specifying the contribution of
each observed count
df : degrees of freedom
Expected: name of list that is for saving expected
frequency
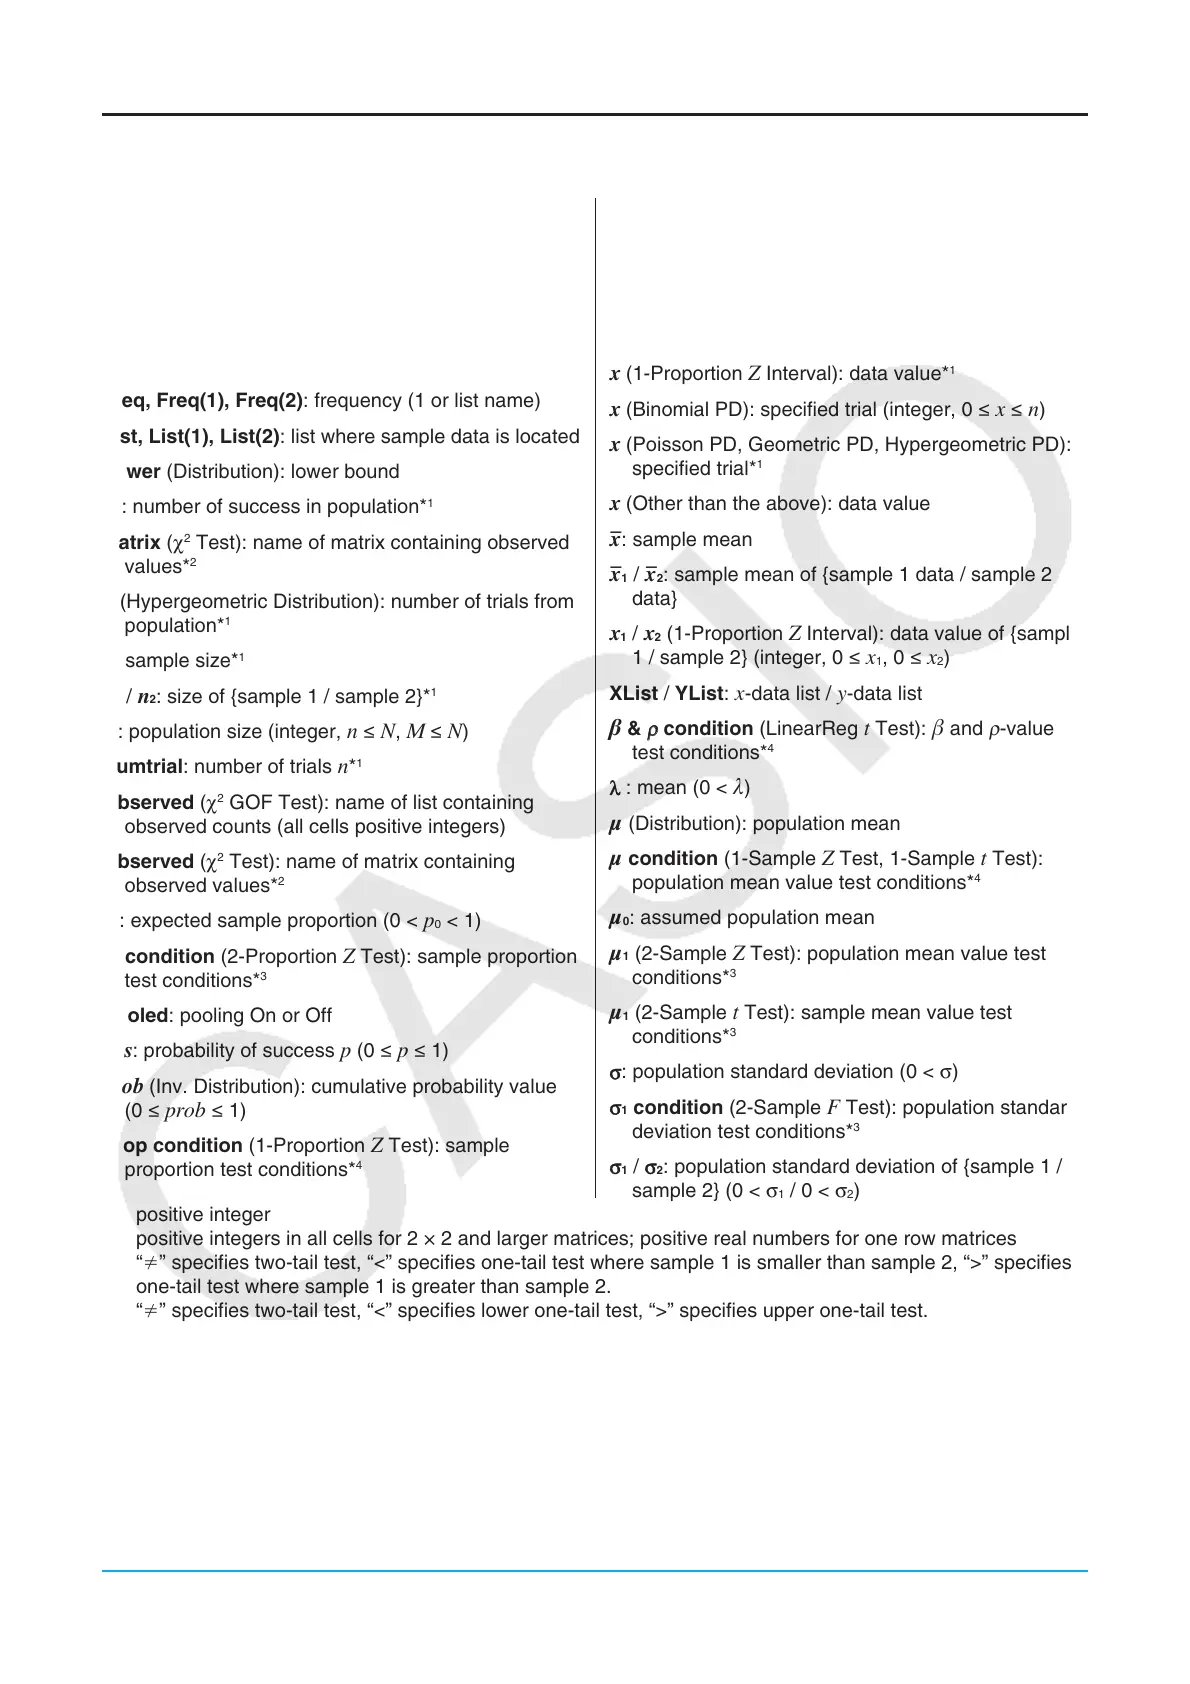
Freq, Freq(1), Freq(2): frequency (1 or list name)
List, List(1), List(2): list where sample data is located
Lower (Distribution): lower bound
M: number of success in population*
1
Matrix (χ
2
Test): name of matrix containing observed
values*
2
n (Hypergeometric Distribution): number of trials from
population*
1
n: sample size*
1
n
1
/ n
2
: size of {sample 1 / sample 2}*
1
N: population size (integer, n s N, M s N)
Numtrial: number of trials
n*
1
Observed (χ
2
GOF Test): name of list containing
observed counts (all cells positive integers)
Observed (χ
2
Test): name of matrix containing
observed values*
2
p
0
: expected sample proportion (0 < p
0
< 1)
p
1
condition (2-Proportion Z Test): sample proportion
test conditions*
3
Pooled: pooling On or Off
pos: probability of success p (0 s p s 1)
prob (Inv. Distribution): cumulative probability value
(0 s prob s 1)
Prop condition (1-Proportion Z Test): sample
proportion test conditions*
4
sx: sample standard deviation (0 < sx)
sx
1
/ sx
2
: sample standard deviation of {sample 1 /
sample 2} (0 < sx
1
, 0 < s
x
2
)
Upper (Distribution): upper bound
x (1-Proportion Z Test): sample value*
1
x (1-Proportion Z Interval): data value*
1
x (Binomial PD): specified trial (integer, 0 s x s n)
x (Poisson PD, Geometric PD, Hypergeometric PD):
specified trial*
1
x (Other than the above): data value
x
_
: sample mean
x
_
1
/ x
_
2
: sample mean of {sample 1 data / sample 2
data}
x
1
/ x
2
(1-Proportion Z Interval): data value of {sample
1 / sample 2} (integer, 0 s x
1
, 0 s x
2
)
XList / YList: x-data list / y-data list
&
ρ
condition (LinearReg t Test): and
ρ
-value
test conditions*
4
: mean (0 < )
(Distribution): population mean
condition (1-Sample Z Test, 1-Sample t Test):
population mean value test conditions*
4
0
: assumed population mean
1
(2-Sample Z Test): population mean value test
conditions*
3
1
(2-Sample t Test): sample mean value test
conditions*
3
: population standard deviation (0 < σ)
1
condition (2-Sample F Test): population standard
deviation test conditions*
3
1
/
2
: population standard deviation of {sample 1 /
sample 2} (0 < σ
1
/ 0 < σ
2
)
*1 positive integer
*2 positive integers in all cells for 2 × 2 and larger matrices; positive real numbers for one row matrices
*3 “” specifies two-tail test, “<” specifies one-tail test where sample 1 is smaller than sample 2, “>” specifies
one-tail test where sample 1 is greater than sample 2.
*4 “” specifies two-tail test, “<” specifies lower one-tail test, “>” specifies upper one-tail test.