Chapter 13: Spreadsheet Application 232
Graph Menu and Graph Examples
The following explains each of the [Graph] menu commands, and shows examples of what happens to the
Graph window when you execute a command. Each command is followed by a button to show the graph
toolbar button that performs the same action as the command.
Tip: The contents of the Spreadsheet window [Graph] menu and the Graph window [Type] menu are identical. On the
Graph window, you can uses the [Type] menu or the applicable icon on the toolbar to change the graph type after a
graph is drawn.
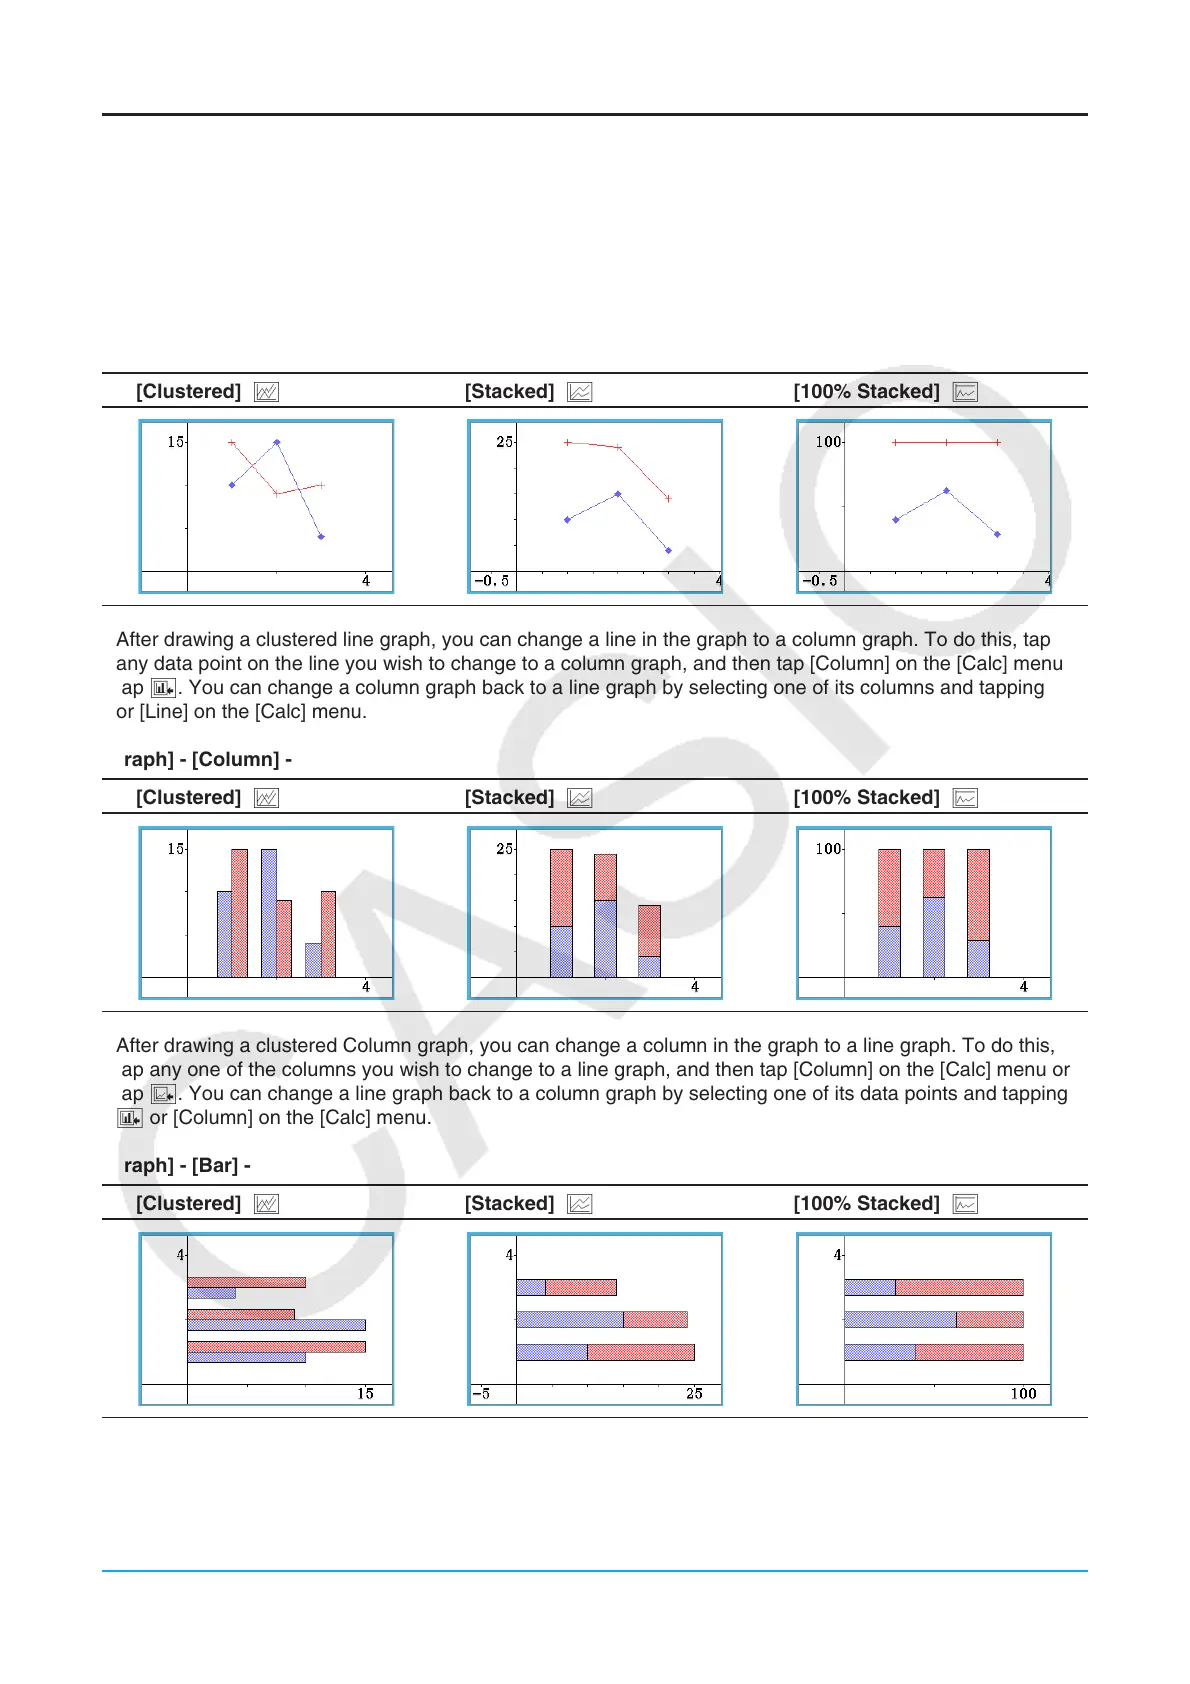
[Graph] - [Line] -
[Clustered] D [Stacked] F [100% Stacked] G
• After drawing a clustered line graph, you can change a line in the graph to a column graph. To do this, tap
any data point on the line you wish to change to a column graph, and then tap [Column] on the [Calc] menu or
tap '. You can change a column graph back to a line graph by selecting one of its columns and tapping z
or [Line] on the [Calc] menu.
[Graph] - [Column] -
[Clustered] D [Stacked] F [100% Stacked] G
• After drawing a clustered Column graph, you can change a column in the graph to a line graph. To do this,
tap any one of the columns you wish to change to a line graph, and then tap [Column] on the [Calc] menu or
tap z. You can change a line graph back to a column graph by selecting one of its data points and tapping
' or [Column] on the [Calc] menu.
[Graph] - [Bar] -
[Clustered] D [Stacked] F [100% Stacked] G