Chapter 7: Statistics Application 137
When
n is an odd number, using the median of the total population as the reference, the population
elements are divided into two groups: values less than the median and values greater than the median.
The median value is excluded. Q
1
and Q
3
then become the values described below.
Q
1
= {median of the group of (n − 1)/2 items from the bottom of the population}
Q
3
= {median of the group of (n − 1)/2 items from the top of the population}
When n = 1, Q
1
= Q
3
= population center point.
[Q
1
, Q
3
on Data] checked: The Q
1
and Q
3
values for this calculation method are described below.
Q
1
= {value of element whose cumulative frequency ratio is greater than 1/4 and nearest to 1/4}
Q
3
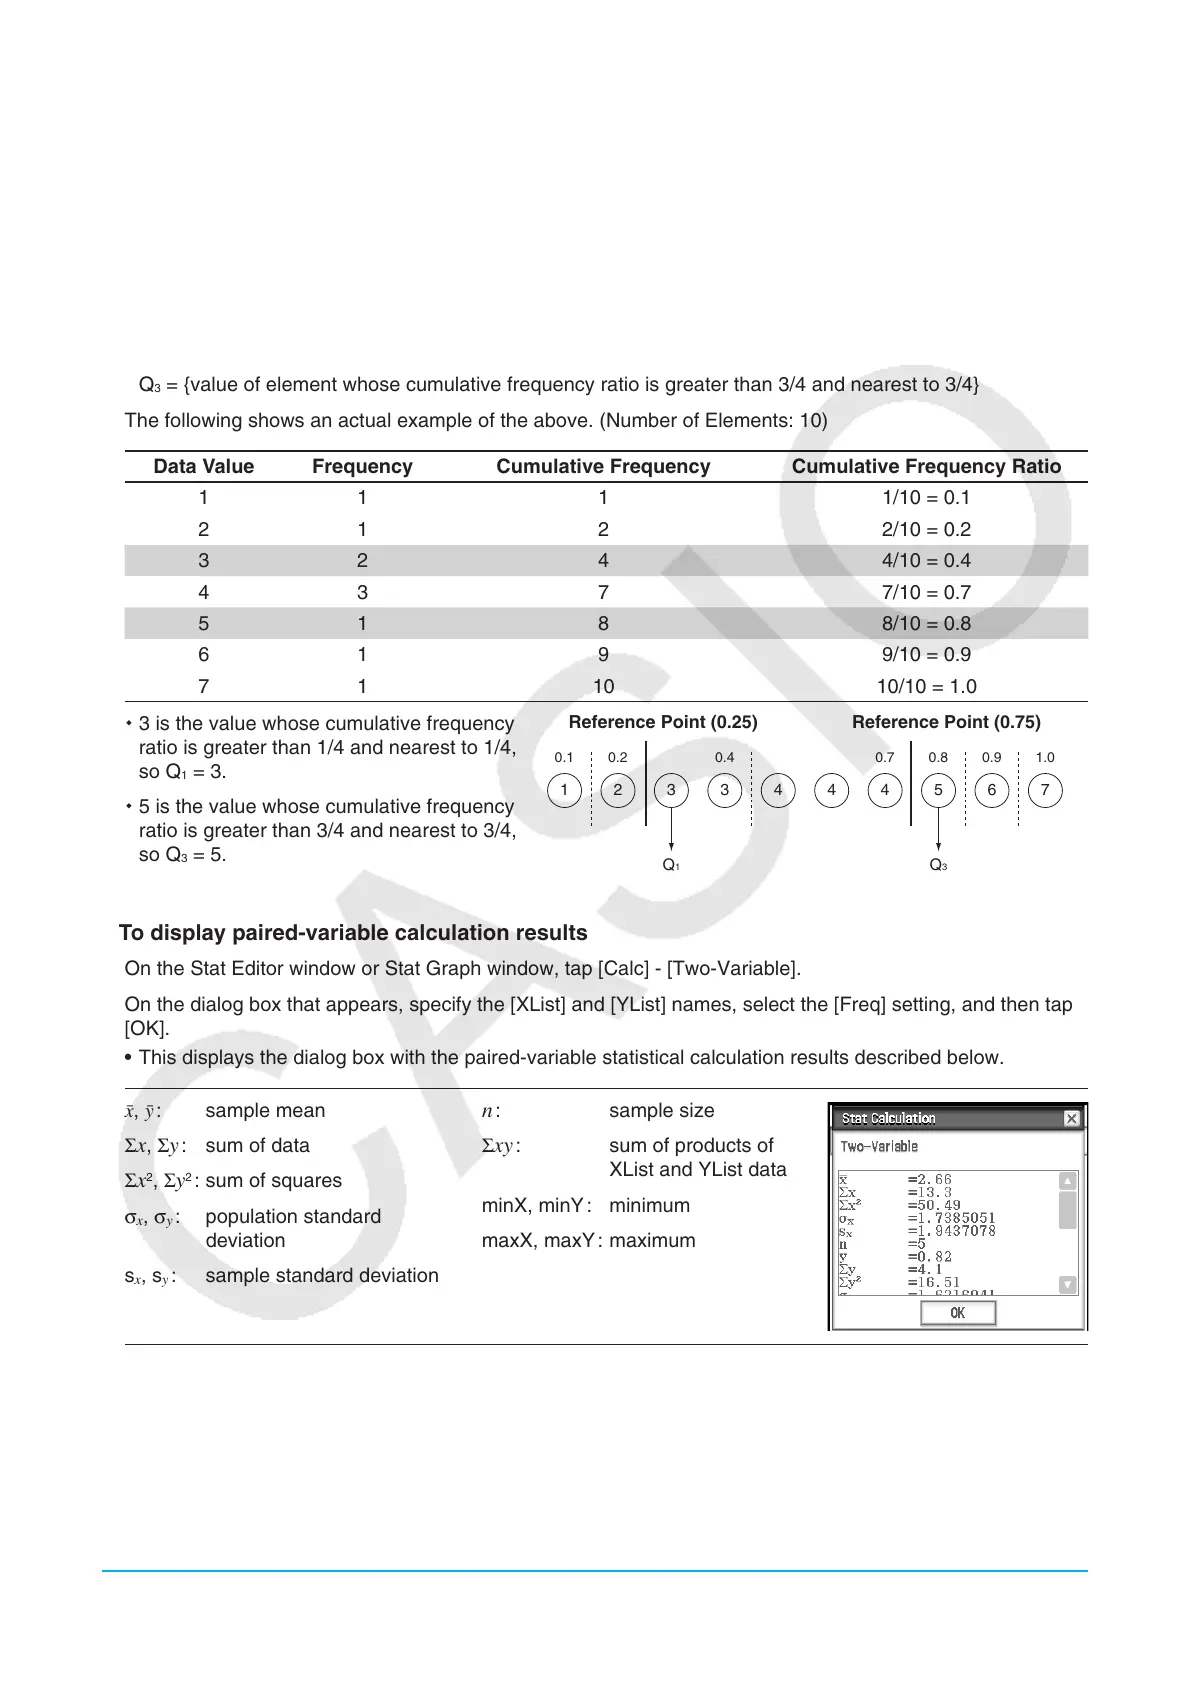
= {value of element whose cumulative frequency ratio is greater than 3/4 and nearest to 3/4}
The following shows an actual example of the above. (Number of Elements: 10)
Data Value Frequency Cumulative Frequency Cumulative Frequency Ratio
1 1 1 1/10 = 0.1
2 1 2 2/10 = 0.2
3 2 4 4/10 = 0.4
4 3 7 7/10 = 0.7
5 1 8 8/10 = 0.8
6 1 9 9/10 = 0.9
7 1 10 10/10 = 1.0
3 is the value whose cumulative frequency
ratio is greater than 1/4 and nearest to 1/4,
so Q
1
= 3.
5 is the value whose cumulative frequency
ratio is greater than 3/4 and nearest to 3/4,
so Q
3
= 5.
Reference Point (0.25) Reference Point (0.75)
Q
1
0.1 0.2 0.4 0.7 0.8 0.9 1.0
Q
3
1 2 63 3 4 4 4 75
u To display paired-variable calculation results
1. On the Stat Editor window or Stat Graph window, tap [Calc] - [Two-Variable].
2. On the dialog box that appears, specify the [XList] and [YList] names, select the [Freq] setting, and then tap
[OK].
• This displays the dialog box with the paired-variable statistical calculation results described below.
o, p : sample mean
Σ
x, Σy : sum of data
Σx
2
, Σy
2
: sum of squares
σ
x
, σ
y
: population standard
deviation
s
x
, s
y
: sample standard deviation
n : sample size
Σxy : sum of products of
XList and YList data
minX, minY : minimum
maxX, maxY : maximum