CassidaPRO Zeus: Service Manual
2018 Cassida Corporation. All rights reserved.
Rev: 09/05/2018
cassidapro.com/partner/
1-4 LED
• Turn on/off the other LEDs of the indicator, PS1, PS2, stacker and reject.
1-5 Scanning Quality
• Check the scanning quality by observing various graphs and images. After running
several bills, the following sensor outputs should be checked. The graphs or images are
assigned to the numeric keys:
• [1] key: Double sensor output
• [2] key: Magnetic sensor output
• [3] key: Position sensor output
• [4] key: Scanned image
• [5] key: CIS shading waveforms
To magnify or reduce the graph, the [8] and [0] keys are used. Press [0] to magnify.
Press [8] to reduce. [ADD] and [STRAP] keys are used to scroll the graph. These keys are
not available for some graphs:
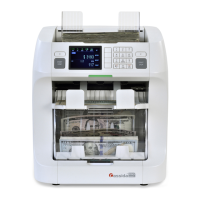
1. Double Sensor Output
• The graph is toggled whenever the [1] key is pressed; Double Sensor Left -> Double
Sensor Right -> Double Sensor All ->
“1051” and “1069” means the sensor output level for one note for Left and Right
respectively. If a double-note is fed, the output signal level will drop below the one-
note level.
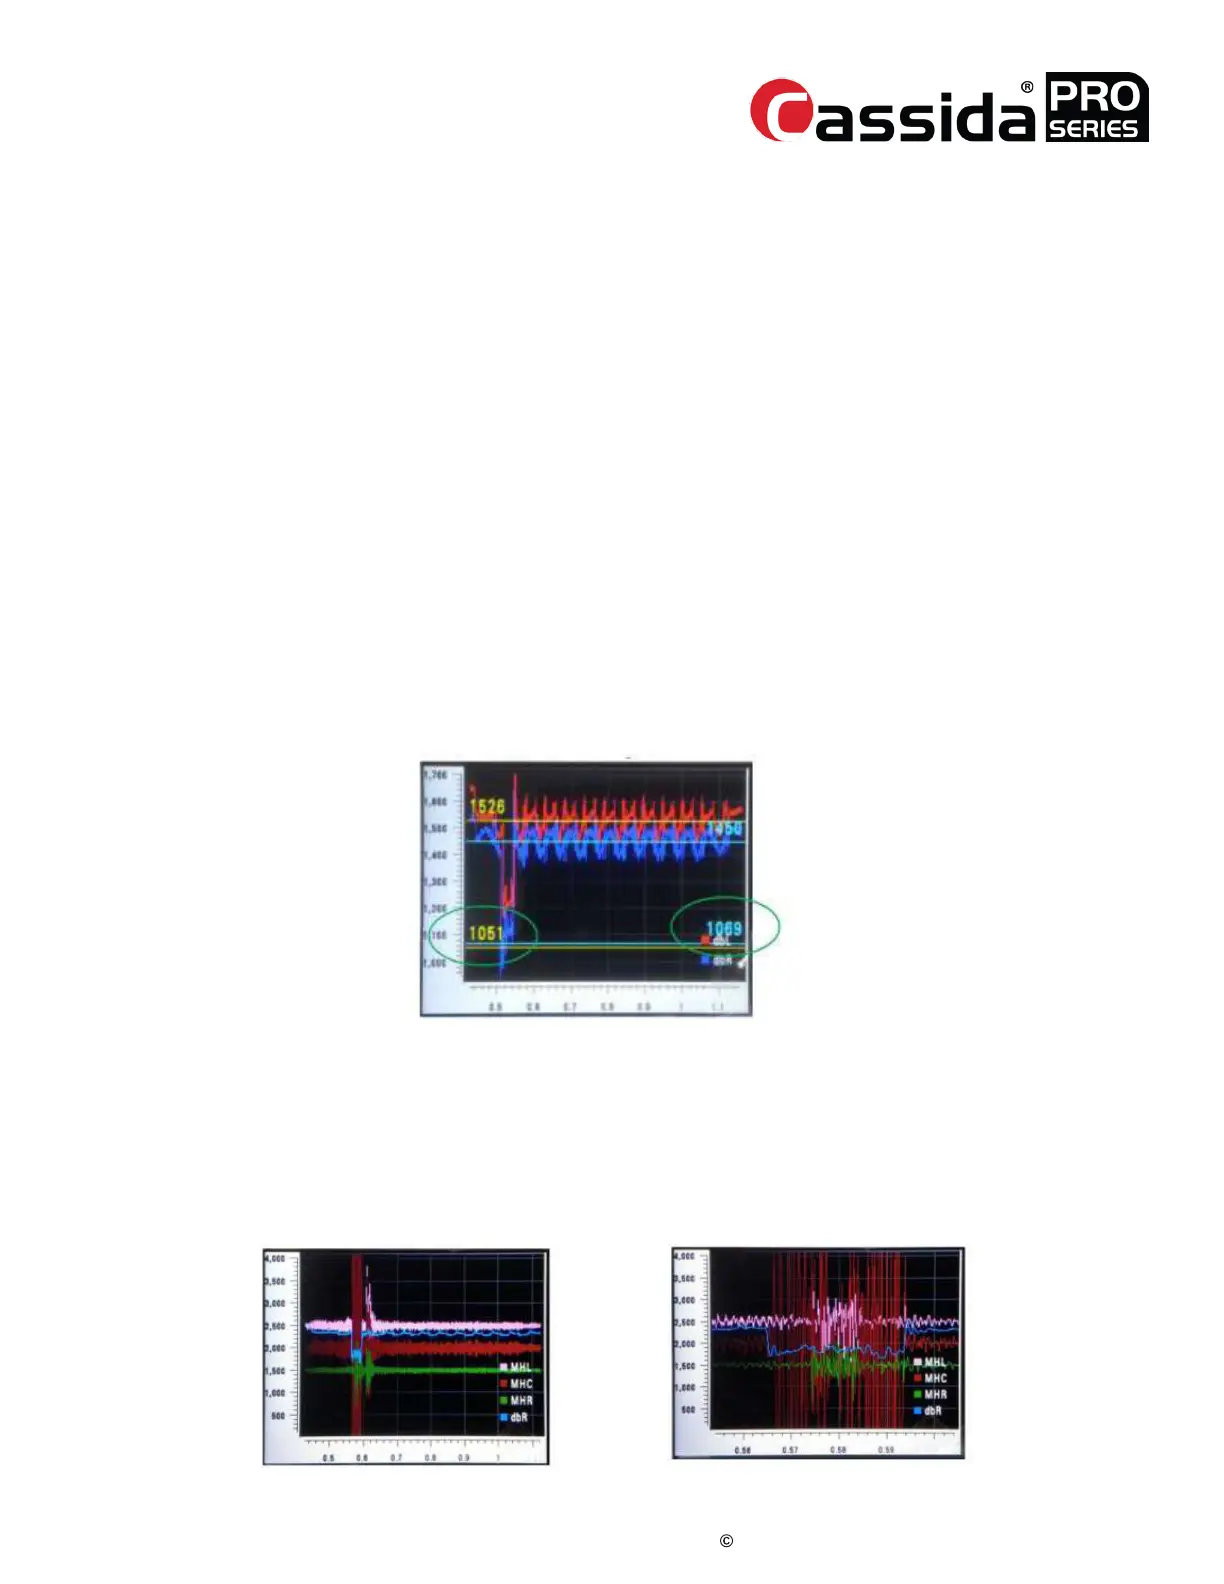
2. Magnetic Sensor Output
• The graph is toggled whenever the [2] key is pressed; Left -> Center -> Right -> ALL.
The picture immediately above on the right is magnified and scrolled properly from the
original magnetic sensors’ output waveform.
SOFTWARE VERSION 6.10.
 Loading...
