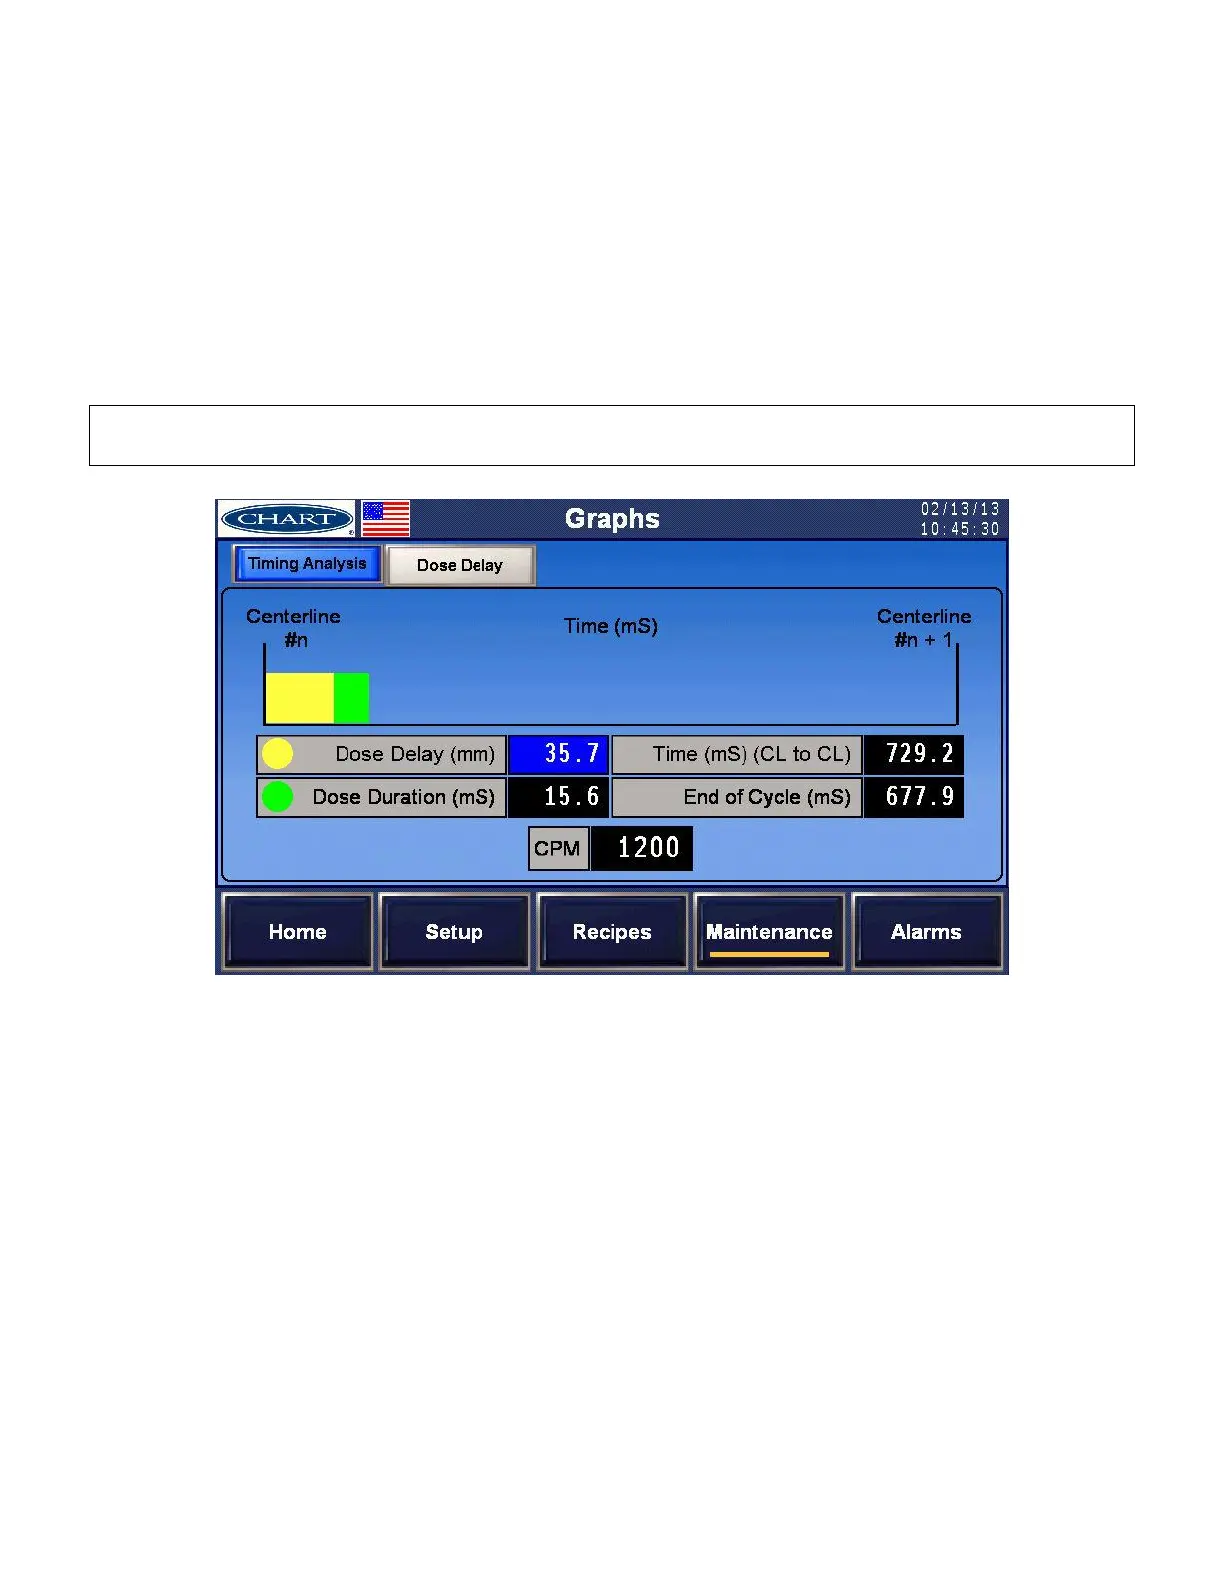
Dose Delay Bar Graph – The graph starts at the left with the sensing of a container by the timing sensor
and ends at the right with the sensing of the next timing sensor. This is the time between timing sensors
and is the total time allocated for the Dosing Delay and the Dosing Duration.
a) Dosing Delay (mS) – The yellow bar graph is the Dosing Delay time.
b) Dosing Duration (mS) – The green bar graph is the Dosing Duration or the time the LN2
valve is actuated.
c) Realtime – The graph updates in realtime showing continuous doses.
d) End of Cycle (mS) – This is the time after the LN2 valve is turned off before the next
timing sensor will arrive.
IMPORTANT: The graph should be consistent and not come close to the next timing sensor line or the
Dose Delay may be too long, the Dose Duration may be too long, or the CPM may be too fast.