Dashboard
Traffic Errors
40 Cisco 350, 350X and 550X Series Managed Switches, Firmware Release 2.4, ver 0.4
3
Traffic Errors
This modules displays the number of error packets of various types that are counted on the
RMON statistics. The view is selected in the configuration options (pencil icon in upper-right
corner).
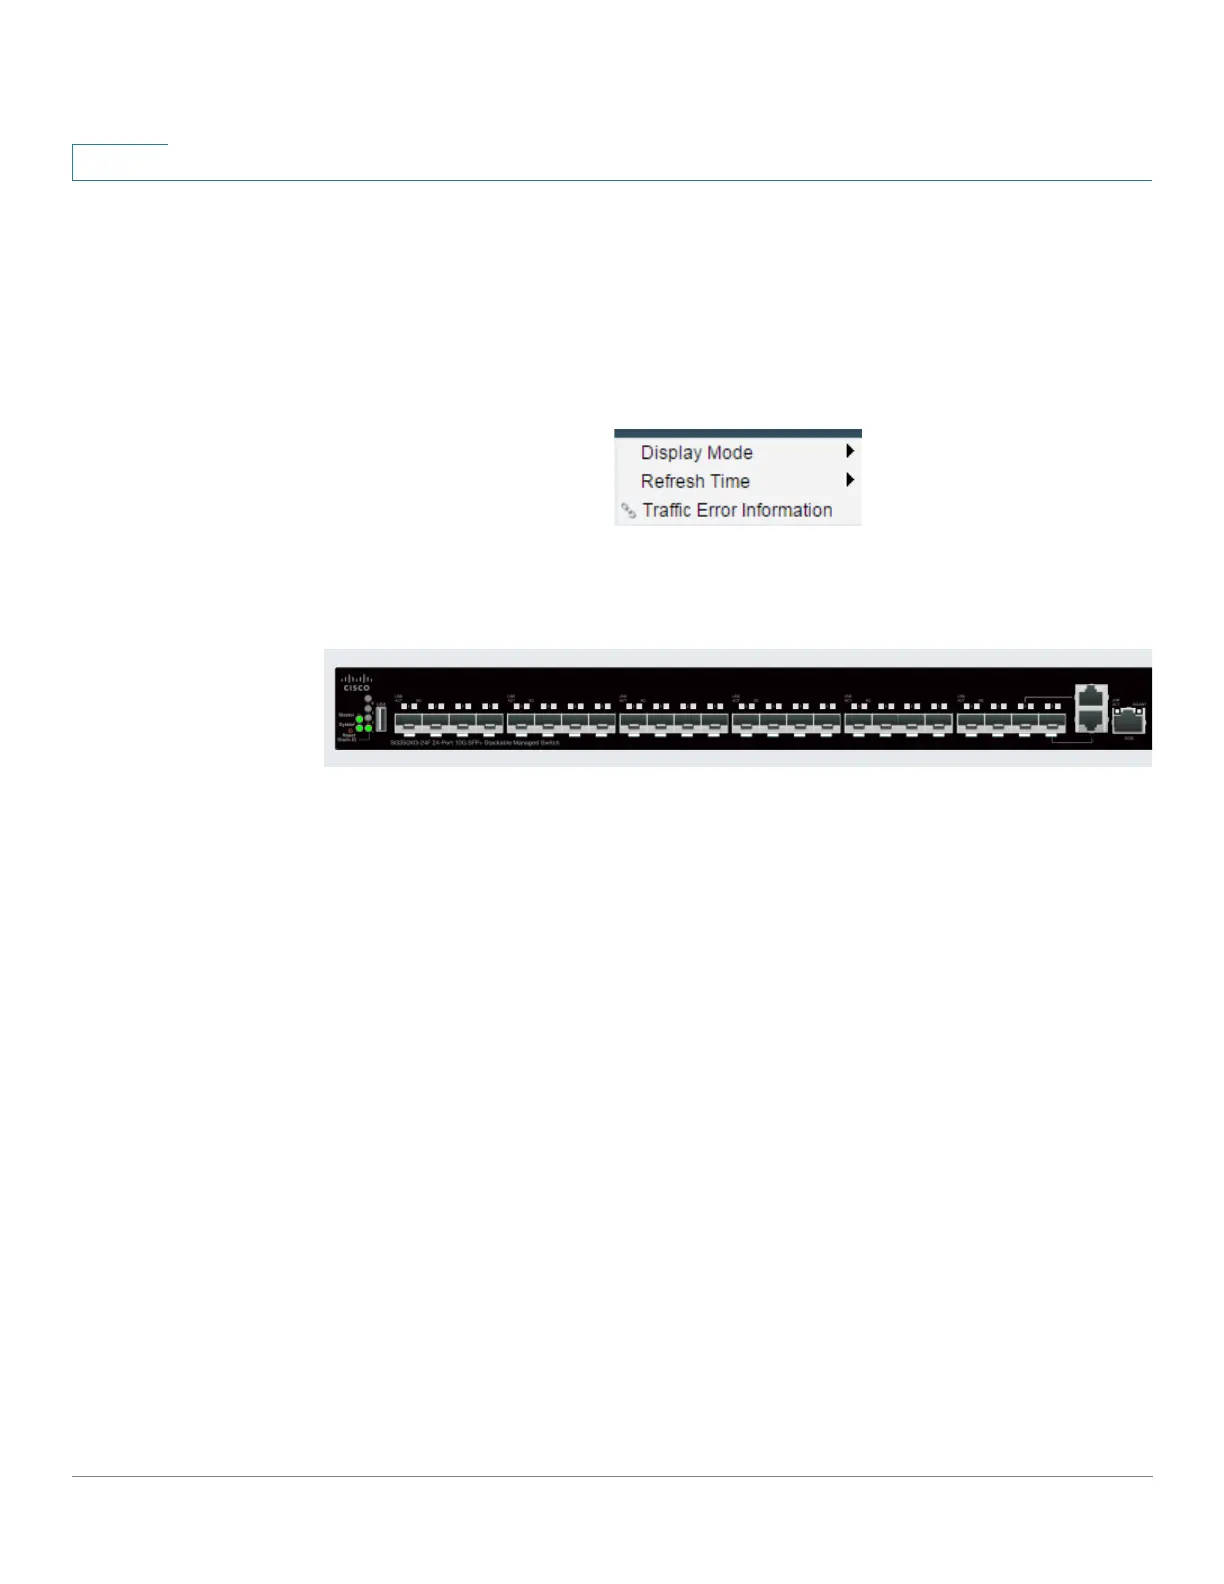
The following can be selected in from the pencil icon:
• Display Mode - Device View
The device module mode displays a diagram of the device, as shown below:
In stacking mode, a drop-down selector enables you to select the device to be viewed.
All suspended ports in the device are shown as red.
Hovering over a suspended port displays a tooltip with the following information:
- Port name.
- If the port is a member of a LAG, the LAG identity of the port.
- Details of the last error logged on the port.
• Display Mode - Table View
- Interface—Name of port
- Last traffic error—Traffic error that occurred on a port and the last time the error
occurred.
• Refresh Time—Select one of the refresh rates.
• Traffic Error Information—Click to link to the Statistics page.
 Loading...