2201R Mobile Tester User Guide
Chapter 2 Instrument setup and general operation
47090/322
Copyright © 2015 Aeroflex Limited. All rights reserved.
30
Understanding the presentation of measurement results
Numerical results
Most measurement results are displayed as a numerical value along with a unit. Examples:
“25.02 dBm” are 25.02 decibels relative to 1 mW (or 318 mW in total).
A peak phase error of “5.46 °” means 5.46 degrees.
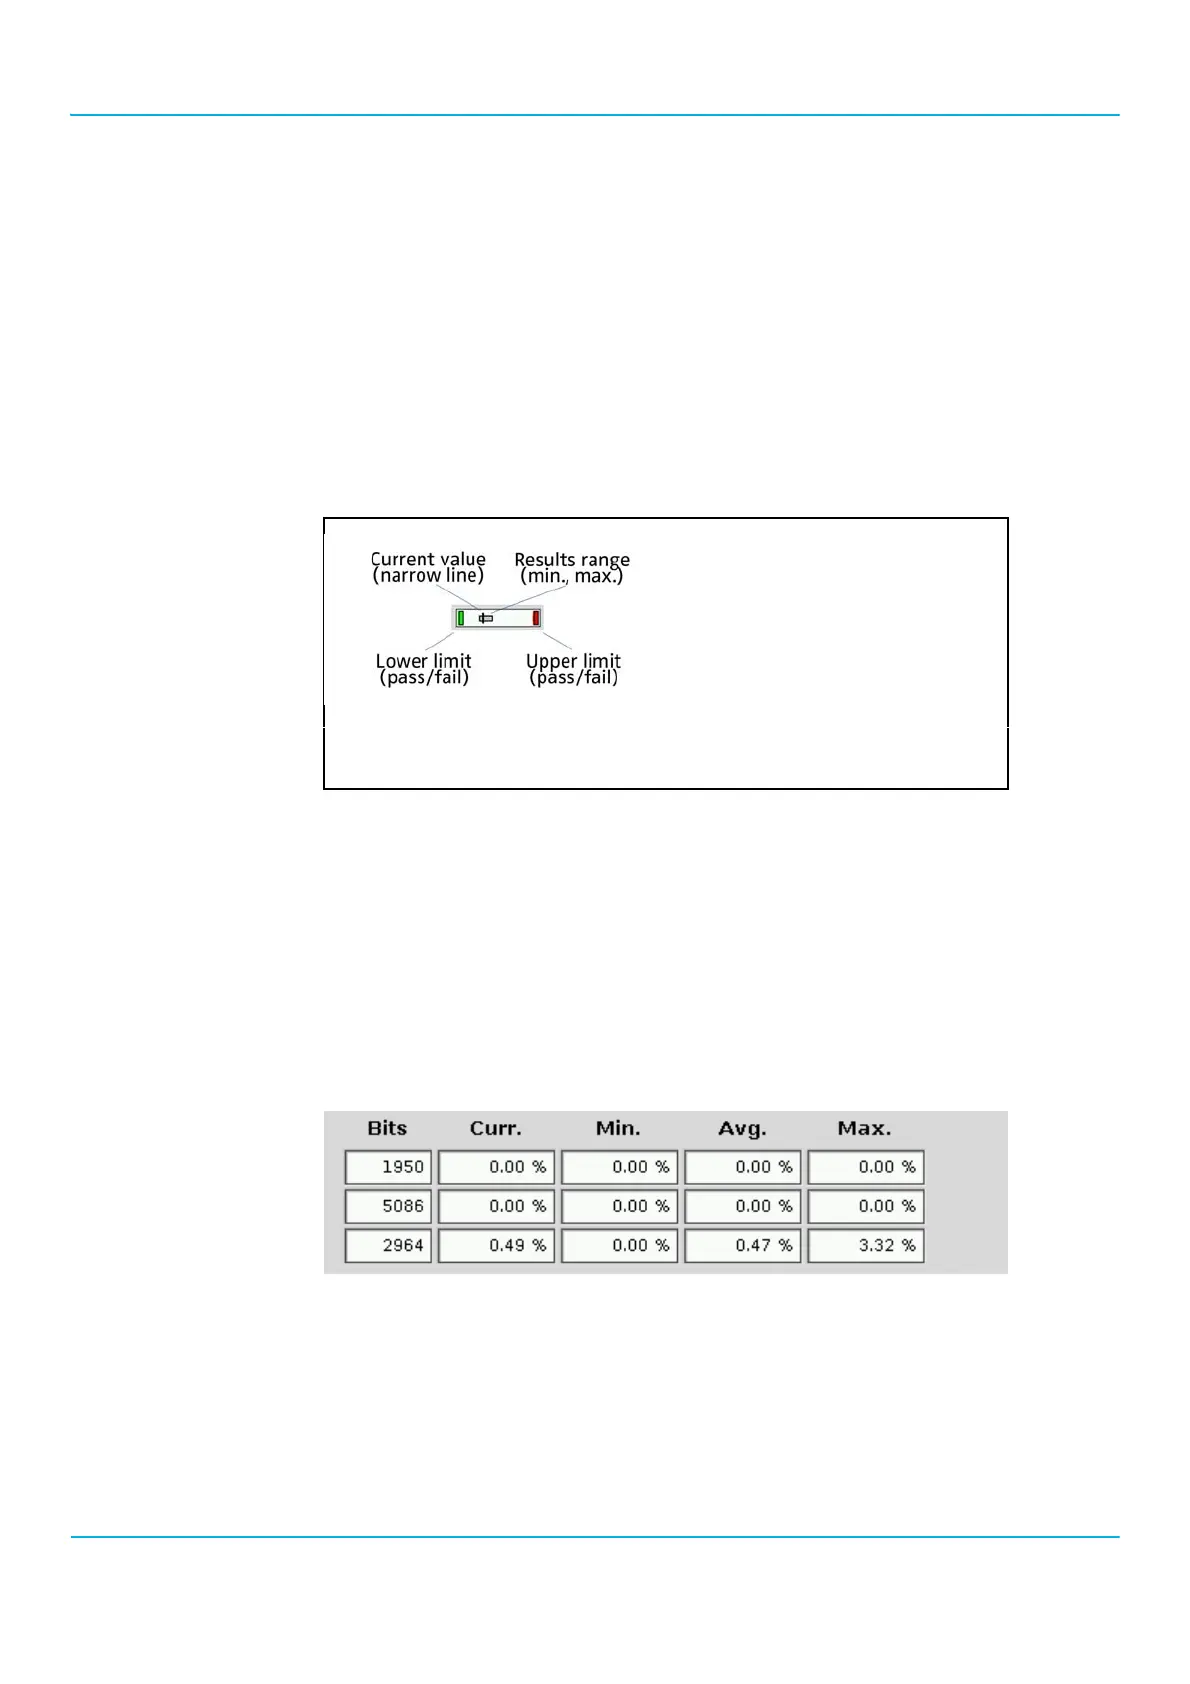
Graphical representation
Some parameters have a statistics bar along with the numerical results, graphically representing the statistics. The
elements of this bar are as follows (see Figure 1).
• The left and right-hand ends of the statistics bar denote the lower and upper limits, respectively. A green field
indicates that all the results were within the limit; a red field indicates that the limit (upper or lower) has been
exceeded.
• The narrow black line indicates the position of the last measurement result (current value).
• The gray bar within the statistics field indicates the range of measurement results relative to the limits. If the
gray bar approaches the upper or lower limit, at least one of the results is close to fail the test.
Numerical results with statistics
This type of measurement result presentation displays the most recent result with average, minimum and maximum
values since the start of the measurements. The best example for this type is the BER Test menu.
Bits
The first column of the table displays the number of bits of each class over which the measurement has been
performed.
Curr.
This column displays the current (most recent) measurement result.
Figure 1 Components of statistics bar