Copyright © 2013, Condor Instruments Ltda. 51
Av. Brigadeiro Luis Antonio, 551, cj 124 - Cep:01318-000
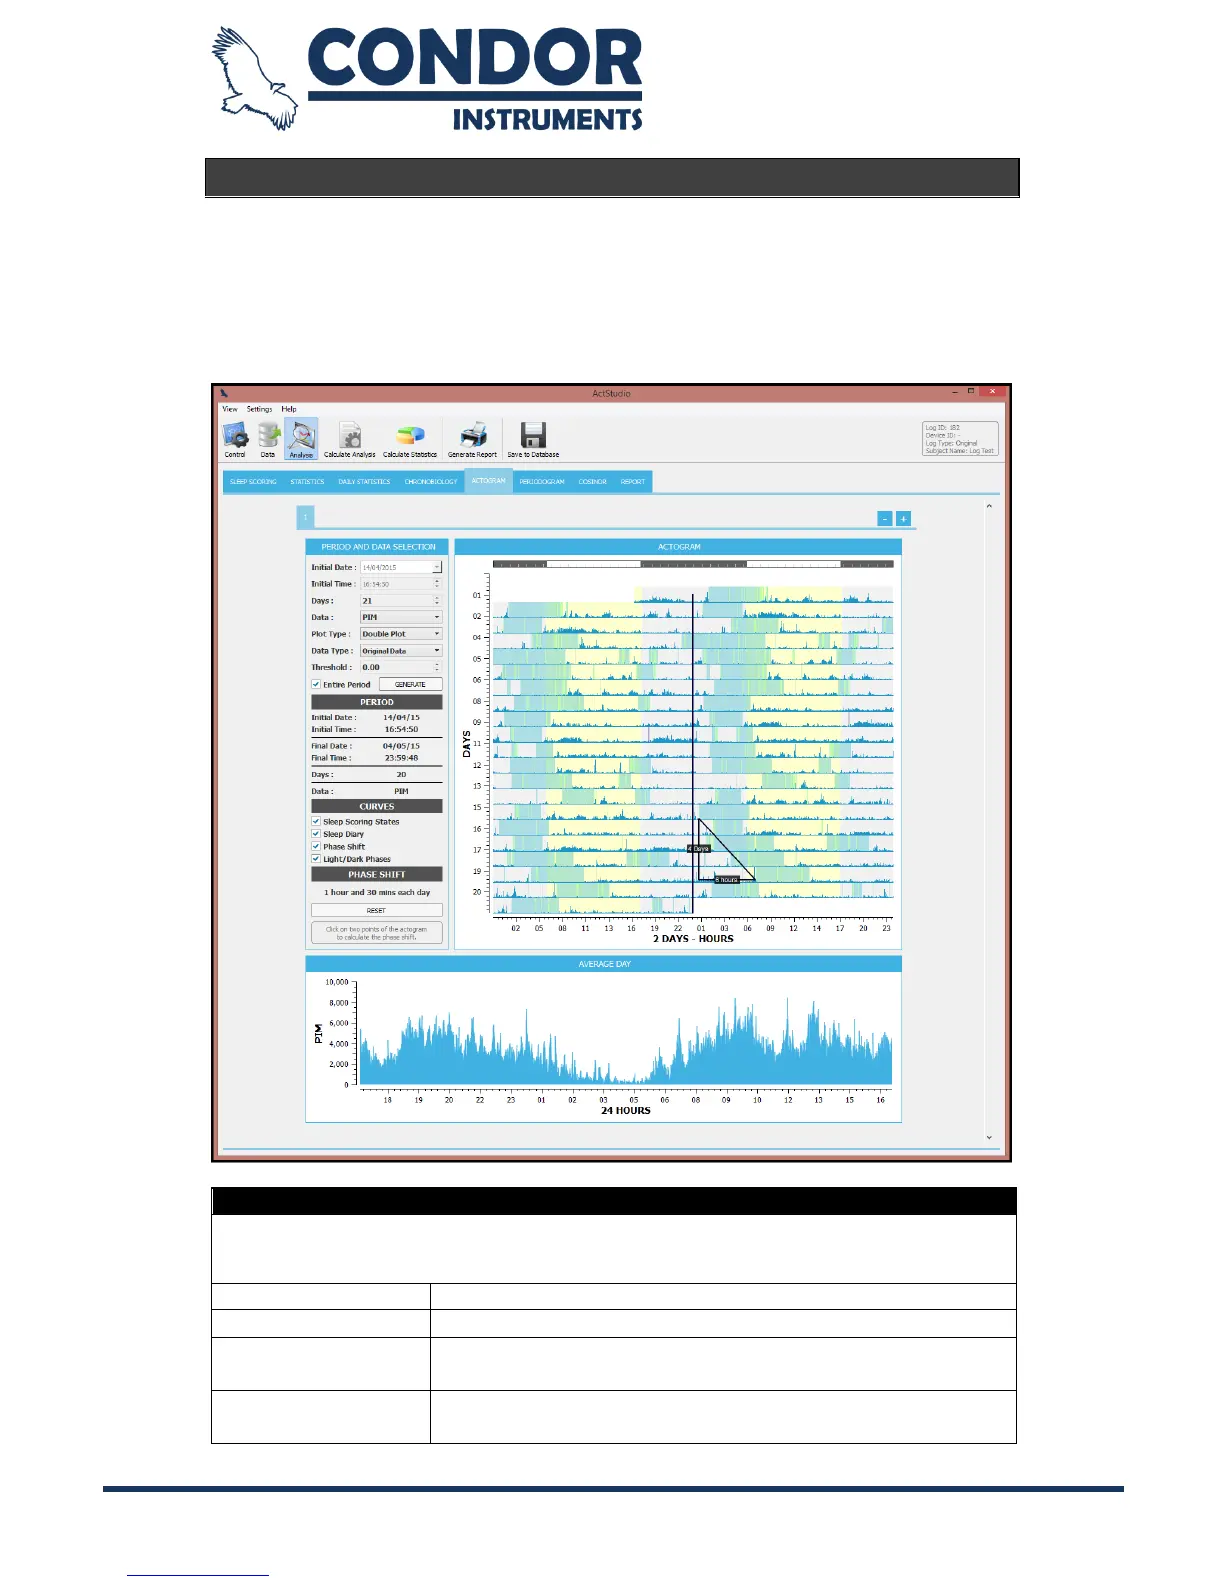
Actogram
The Actogram shows a time series along two time axes. The X axis represents
the period (24 hours – single plot or 48 hours – double plot) and the Y axis
represents the selected data in days. The actogram will also print the sleep
scoring states (if the sleep scoring was calculated), the sleep diary (if the user
has entered some values) and the light/dark phases.
Fields used to select the period and the data that will be used to generate the
actogram and the average day.