137
10.3 Production Graphs
The following sections illustrate the inverter production/derating in terms of
ambient temperature, altitude and grid voltage.
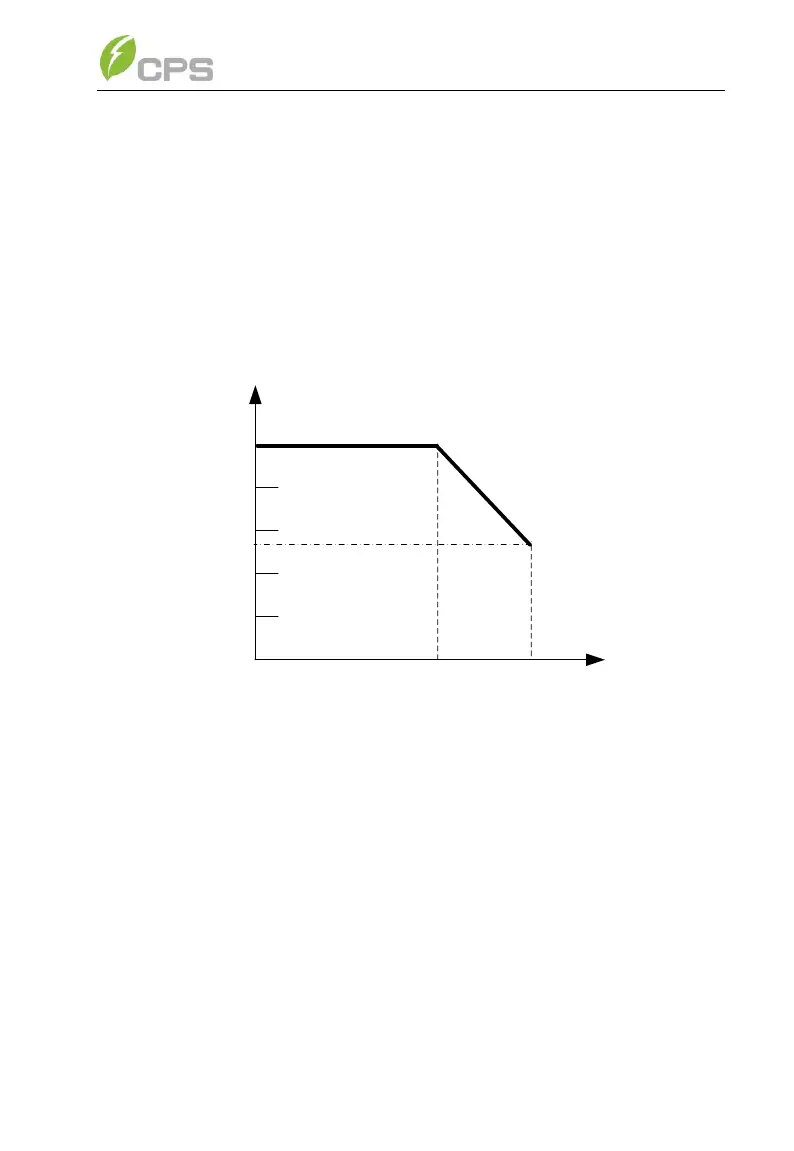
10.3.1 High Temperature Derating Graph
When the ambient temperature is higher than 113℉ (45℃), the inverter
output power (Pn) will begin to derate, as shown in Figure 10-1:
Figure 10-1 SCA25KTL-DO/US-208 Derating Curve with High Temperature
10.3.2 Altitude Derating Graph
When the altitude is higher than 9842.5ft (3000m), the rated output power
(Pn) of the inverter will decrease, as shown in Figure 10-2: