Curtis 1243GEN2 Manual
37
THROTTLE INPUT (percent of active range)
CONTROLLER OUTPUT (percent PWM)
80%
60%
50%
40%
30%
20%
THROTTLE MAP
100
90
80
70
60
50
40
30
20
10
0
100908070605040302010 0
SPEED PARAMETERS
10% Creep Speed
90% Max Speed
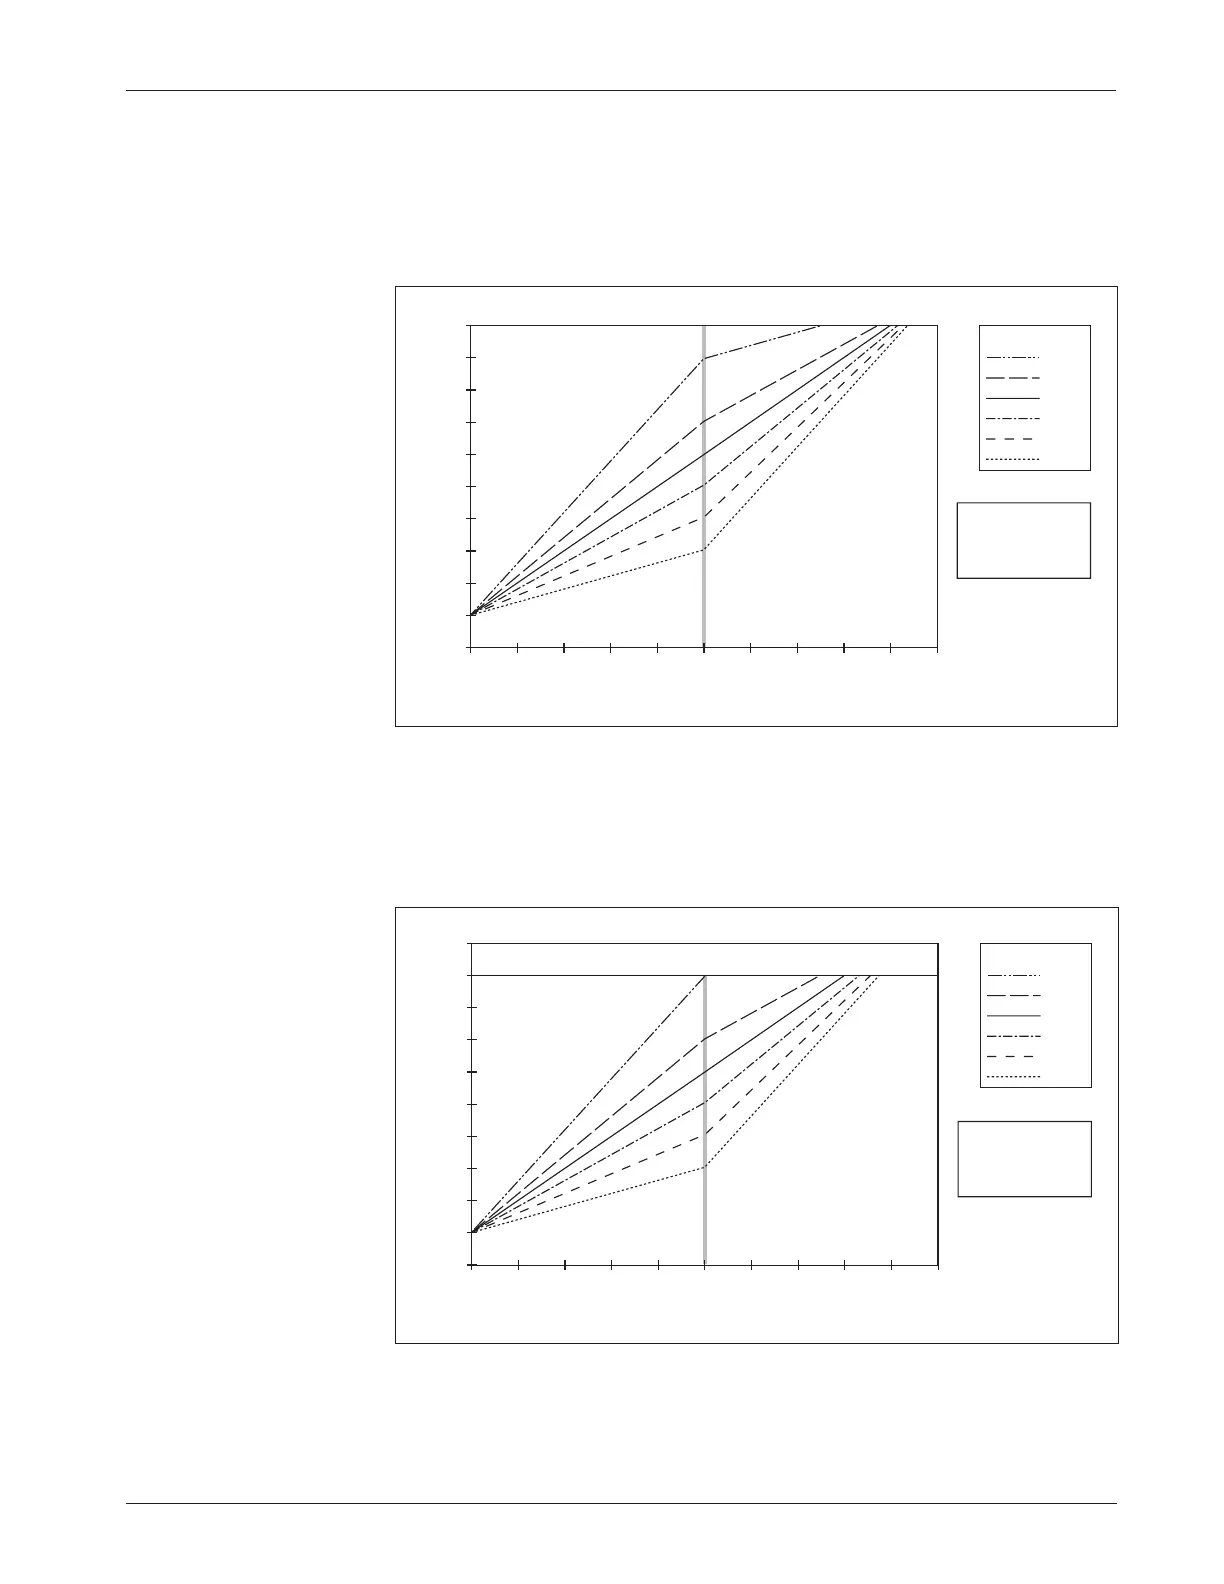
Fig. 19 Throttle maps for
controller with maximum
speed set at 90% and
creep speed set at 10%.
THROTTLE INPUT (percent of active range)
CONTROLLER OUTPUT (percent PWM)
80%
60%
50%
40%
30%
20%
THROTTLE MAP
100
90
80
70
60
50
40
30
20
10
0
100908070605040302010 0
SPEED PARAMETERS
10% Creep Speed
100% Max Speed
3 — PROGRAMMABLE PARAMETERS:
Throttle Parameters
Fig. 18 Throttle maps for
controller with maximum
speed set at 100% and
creep speed set at 10%.
Reducing the max speed setting clips off the top of the throttle map.
Figure 19 shows throttle map curves with the same 10% creep speed setting and
the maximum speed setting dropped to 90%. The curves in this example are
exactly as in Figure 18, except the PWM output hits a ceiling at 90%.
The throttle map is tuned as part of the vehicle performance adjustment
process (Section 5).
Increasing the creep speed value adds to the applied throttle and simply
shifts the curves up. As shown in Figure 18, a creep speed setting of 10% with
the Throttle Map set at 50% gives 60% PWM output (50% + 10%) at half
throttle.