EasyManuals Logo

D-Link DGS-3120-24TC User Manual

D-Link DGS-3120-24TC
339 pages
To Next Page IconTo Next Page
To Previous Page IconTo Previous Page
Page #290 background imageLoading...
Page #290 background image
xStack® DGS-3120 Series Managed Switch Web UI Reference Guide
282
Chapter 11 Monitoring
Utilization
Statistics
Mirror
sFlow (EI Mode Only)
Ping Test
Trace Route
Peripheral
Utilization
CPU Utilization
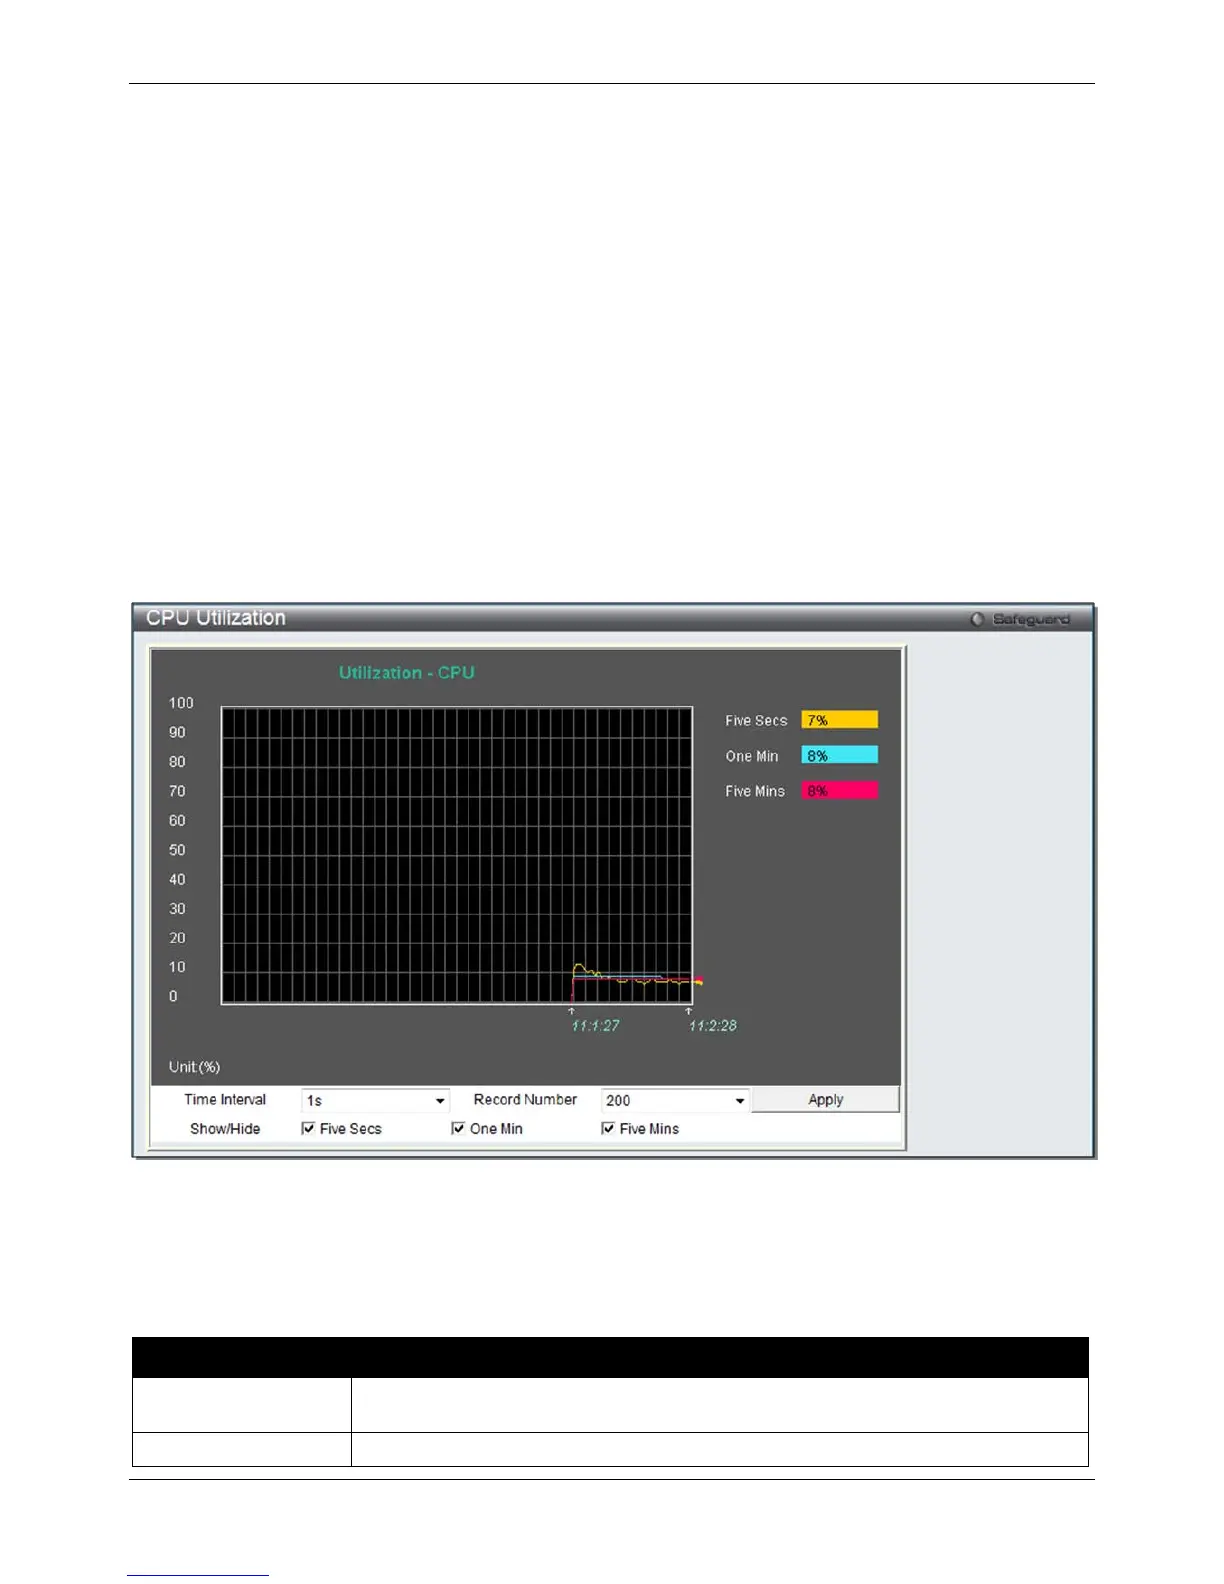
Users can display the percentage of the CPU being used, expressed as an integer percentage and calculated as a
simple average by time interval.
To view this window, click Monitoring > Utilization > CPU Utilization as shown below:
Figure 11–1 CPU Utilization window
To view the CPU utilization by port, use the real-time graphic of the Switch and/or switch stack at the top of the web
page by simply clicking on a port. Click Apply to implement the configured settings. The window will automatically
refresh with new updated statistics.
The fields that can be configured are described below:
Parameter Description
Time Interval Select the desired setting between 1s and 60s, where "s" stands for seconds. The
default value is one second.
Record Number
Select number of times the Switch will be polled between 20 and 200. The default

Table of Contents

Questions and Answers:

Question and Answer IconNeed help?

Do you have a question about the D-Link DGS-3120-24TC and is the answer not in the manual?

D-Link DGS-3120-24TC Specifications

General IconGeneral
Primary FunctionManaged Switch
Ports24 x 10/100/1000Base-T
Switching Capacity48 Gbps
Forwarding Rate35.7 Mpps
MAC Address Table Size16K entries
RAM128 MB
Flash Memory32 MB
VLAN SupportYes
Uplink Ports4 x 1G SFP
Jumbo Frame Support9KB
Layer 3 FeaturesStatic Routing
Power SupplyAC 100-240V, 50/60Hz
Power Consumption30 Watts
Operating Temperature0 to 50 °C
Storage Temperature-40°C to 70°C
Humidity10% to 90% non-condensing

Related product manuals