Page 55
Pulmonary Function Test • Publication 014181-001 Rev 02 • www.datasci.com ©2023 Data Sciences International
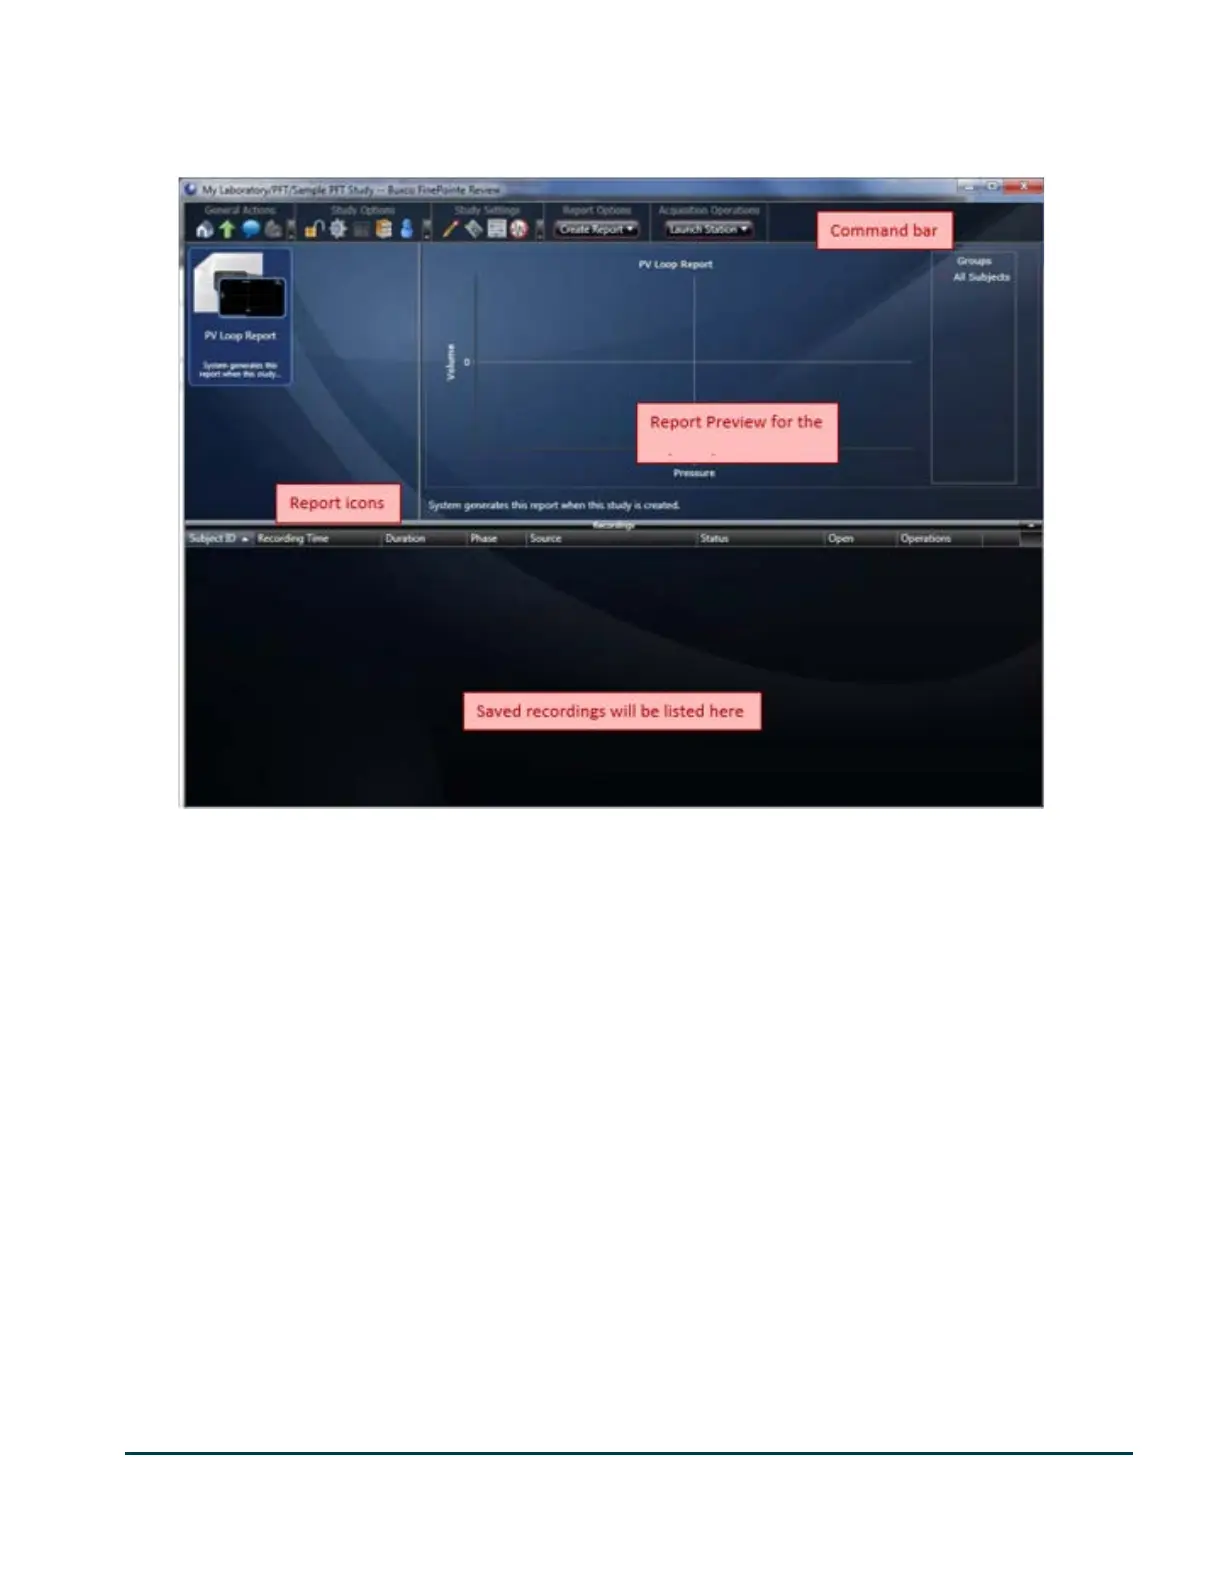
Once you click finish, FinePointe creates the study database and opens the study. The image below shows what an
empty study will look like.
The study page has a command bar across the top. This bar has buttons which allow you to access forms and other
pages within the study. If you hover the mouse over a button, a tool tip will provide you with a text description of
the operation performed, page navigated to, or form opened.
The report icons show a single icon for each report. You can have as many reports as you want within a study. If
you double click on a report icon, you can open the report and get complete details about the report. Also, you can
modify characteristics of the report.
The report preview gives you a visual preview of the report icon selected in the report icons area. You can quickly
review data in the reports by single clicking each report icon and looking at the report preview.
The list below the reports shows you the recordings you made. Each time you acquire data for a subject, you will
have a row added to this list once the data has been committed to the database. If you double click on a row, you
can open the recording and view the data just as it was recorded.