User Menu Parameters
93 Liebert
®
iCOM
®
for Liebert DSE
™
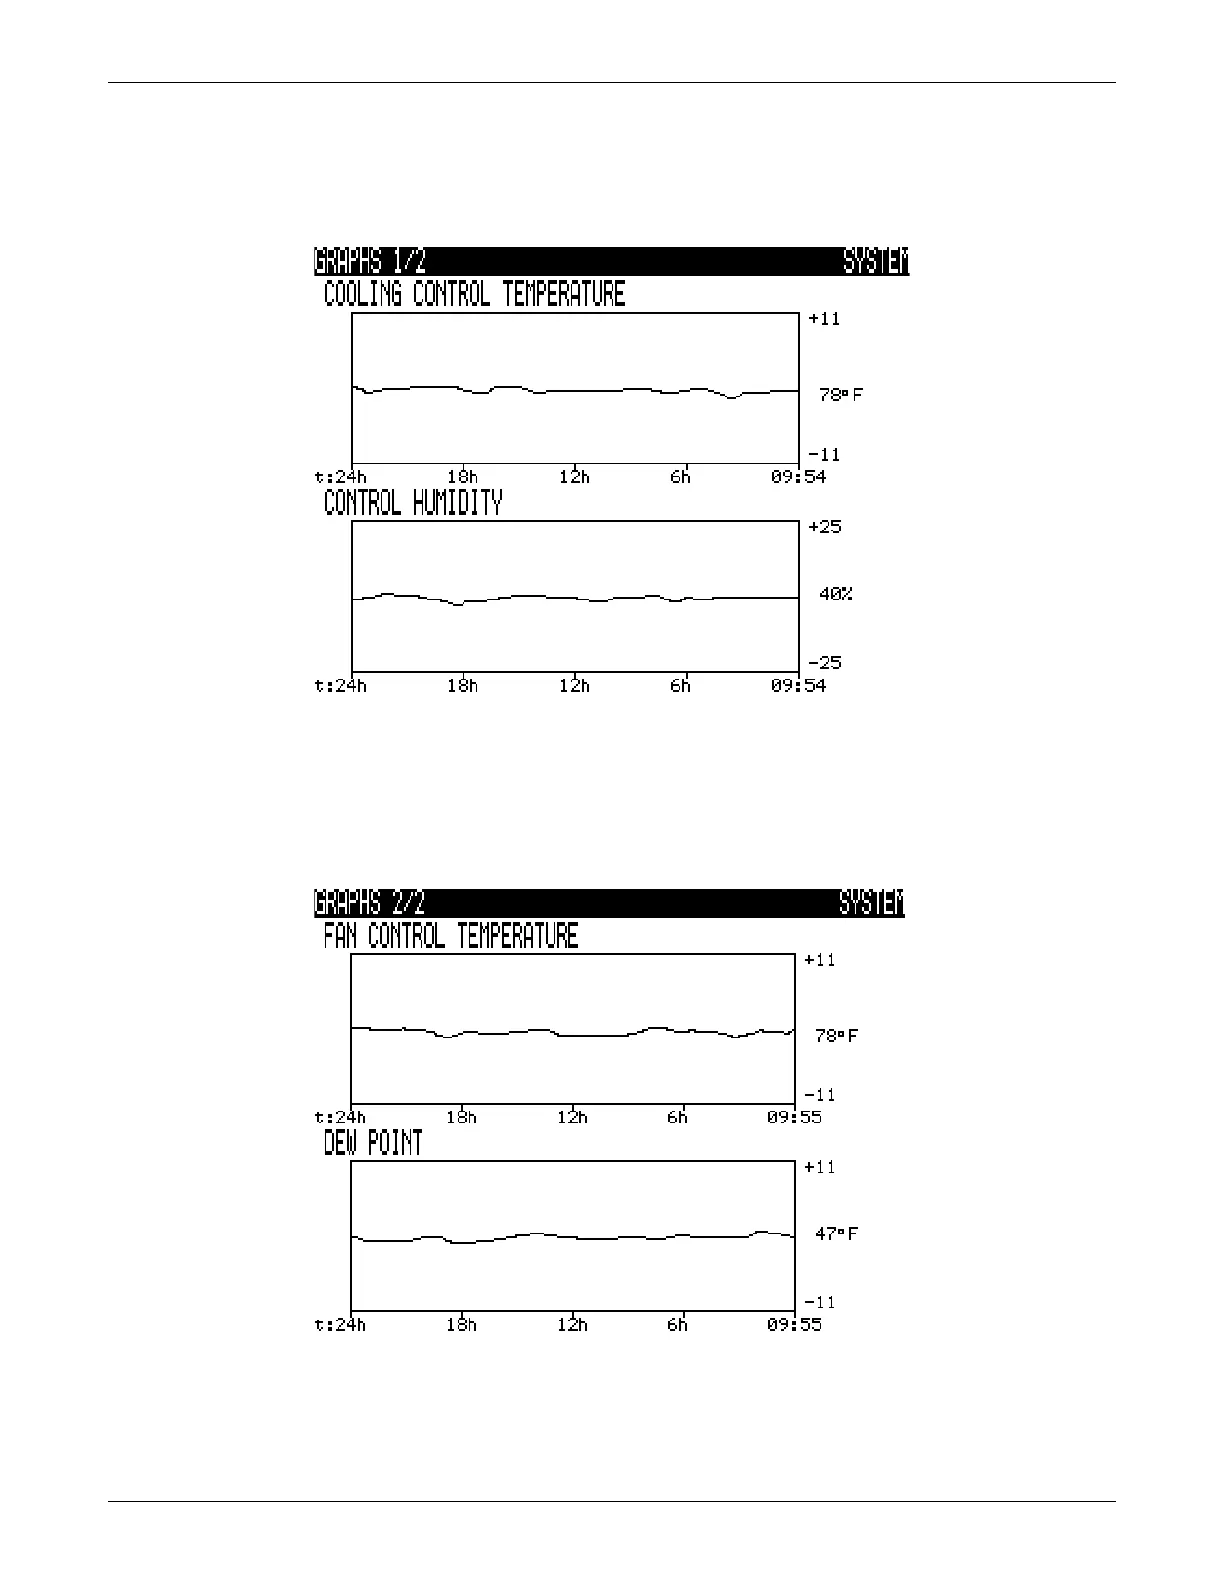
7.2 User-Graphic Menu Screens
Graphic screens allow the user to view temperature and humidity graphs. Nine flexible time scales
with ranges up to 16 days are available.
Figure 66 Graphs, page 1
There are two line trend graphs in Liebert iCOM. The upper graph displays temperature data and the
lower graph displays humidity data. Each graph can be customized by changing the span of time and
the range of the sensor readings.
Each unit has its own temperature and humidity graphs as well as a system graph which displays an
average of all connected sensors in the network of units.
Figure 67 Graphs, page 2
Spare Part List
Spare Parts—The spare parts lists contains a detailed description and part number that can be used
to order parts for the unit. These part numbers are specific to each model and option installed on the
unit.
 Loading...