Performance
© 2013 EMP, Inc 9
Performance
Pump Performance Curves
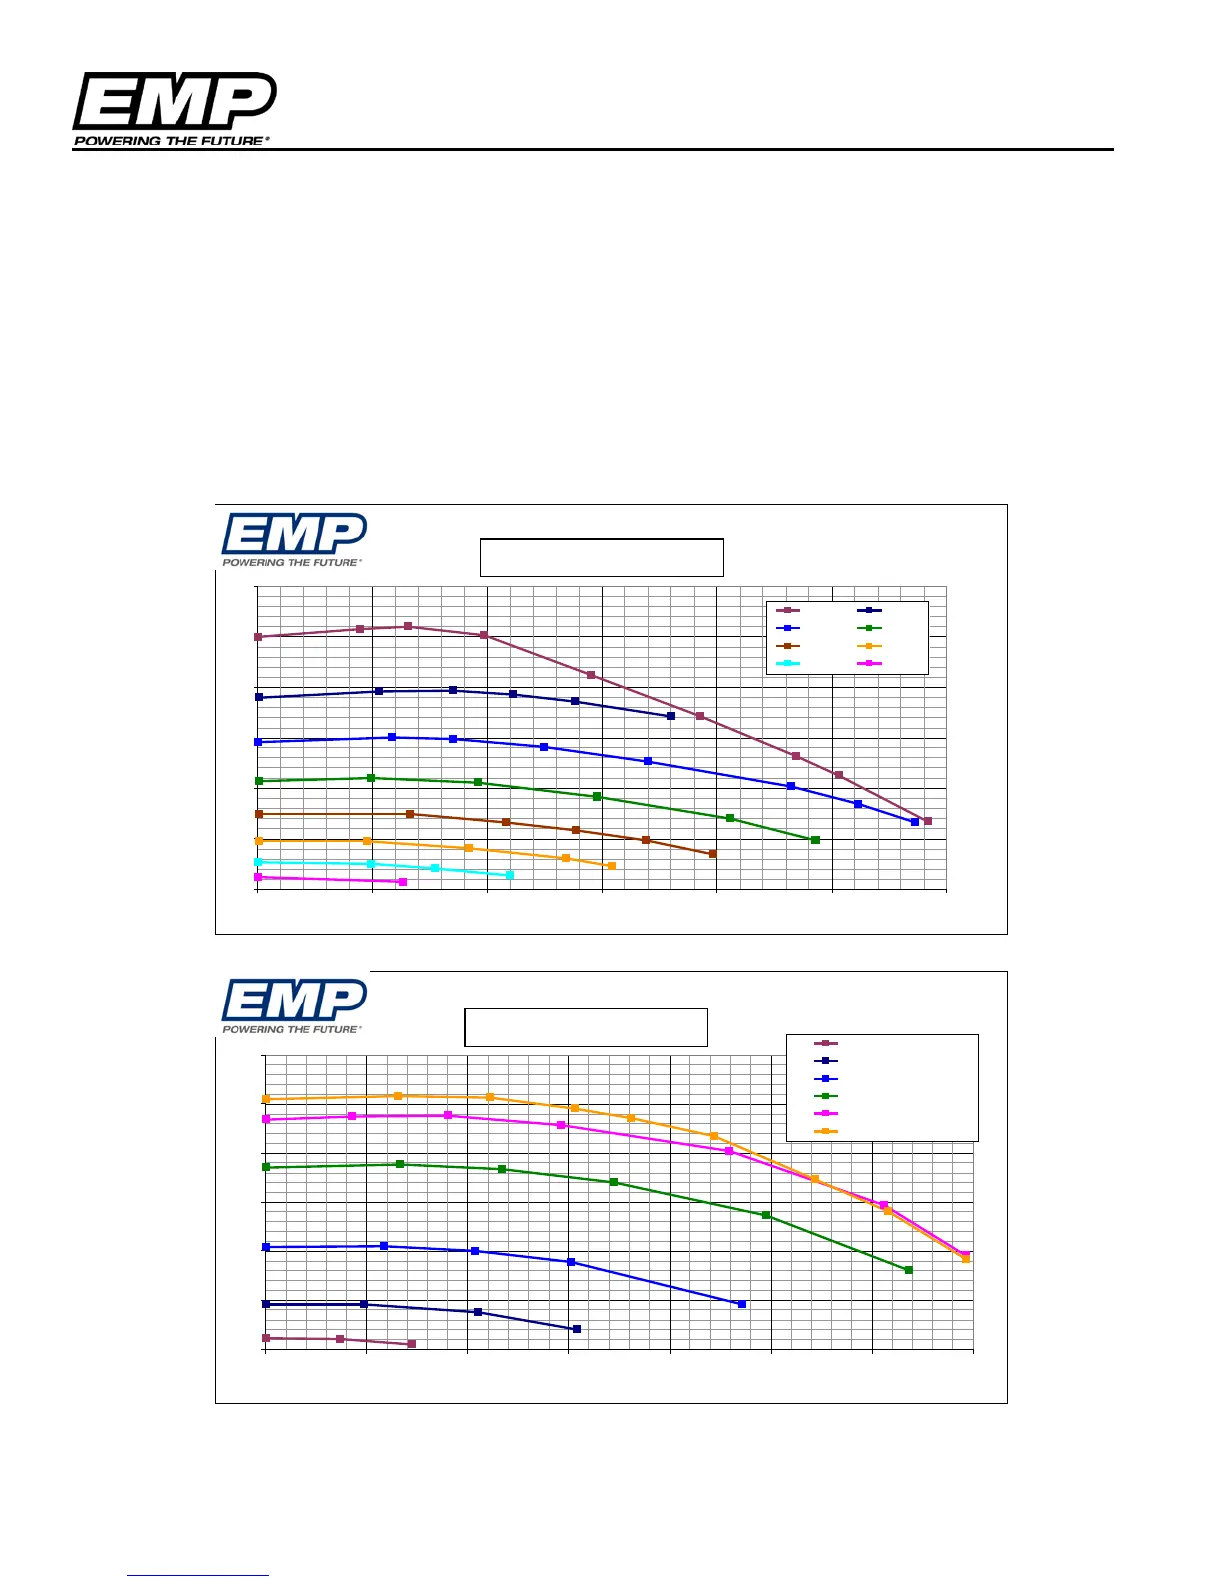
The pump performance curves shown in the illustrations below outline the maximum capability of the pump at
maximum speed of the pump. Following the installation guidelines will result in peak performance matching
the illustrated operation. Pump speed reduction will reduce the output capability.
The static pressure curve represents the pressure rise across the pump for a given flow. If the inlet pressure of
the pump is negative, the outlet pressure of the pump is reduced by the inlet suction. Be aware of this situation
in systems with little or no head pressure on the system.
Flow -vs- Static Pressure Rise
WP29 12 volt Pump
0
5
10
15
20
25
30
0 5 10 15 20 25 30
14V Full 4000
3500
3000
2500
2000
1500 1000
Static Pressure Rise -vs- Flow
WP29 - 24 volt pump
0
5
10
15
20
25
30
0 5 10 15 20 25 30 35
WP29 24V (1000)
WP29 24V (2000)
WP29 24V (3000)
WP29 24V (4000)
WP29 24V (4500)
WP29 24V (max speed)