72
73
4
1 2
1
3
2 3
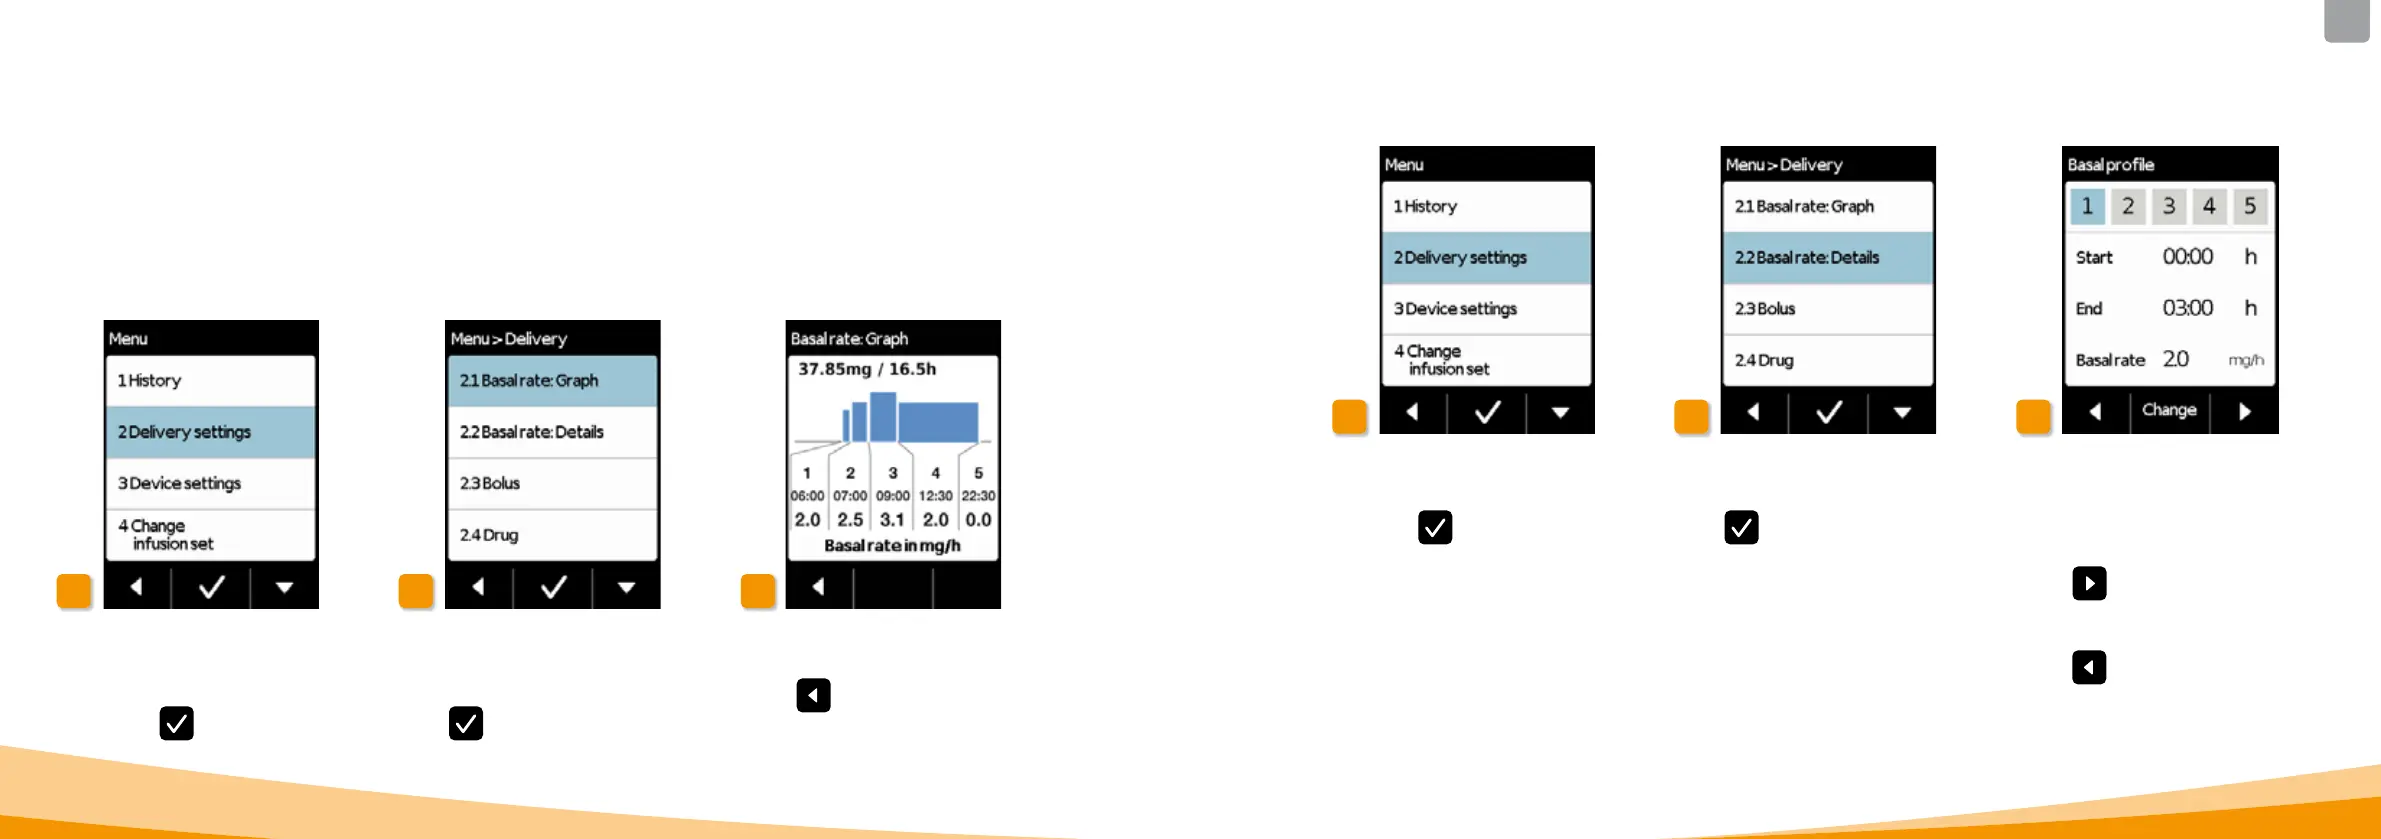
Selecting delivery settings
Select Delivery settings in the menu
and press
.
Selecting the overview
Select Basal rate: Graph and
press
.
4.5.2 BASAL RATE: GRAPH
There are two ways of viewing your basal profile:
• as an overview in a 24h graph
• with the precise values for each time period
Selecting the basal profile time
period
You can see the settings for the first
time period of your basal profile.
Press
to view all time periods
consecutively.
Press
to return to the delivery
settings.
Basal rate: Details
Select Basal rate: Details and
press
.
Selecting the delivery settings
Select Delivery settings in the menu
and press
.
4.5.3 BASAL RATE: DETAILS
24h graph is displayed
Press
to return to the delivery
settings.