156
157
-3
-2.8
-2.6
-2.4
-2.2
-2
-1.8
-1.6
-1.4
-1.2
-1
-0.8
-0.6
-0.4
-0.2
0
0 1 2 3 4 5 6 7 8 9 10 11 12 13 14 15 16 17 18 19 20 21 22 23 24 25 26 27 28 29 30 31
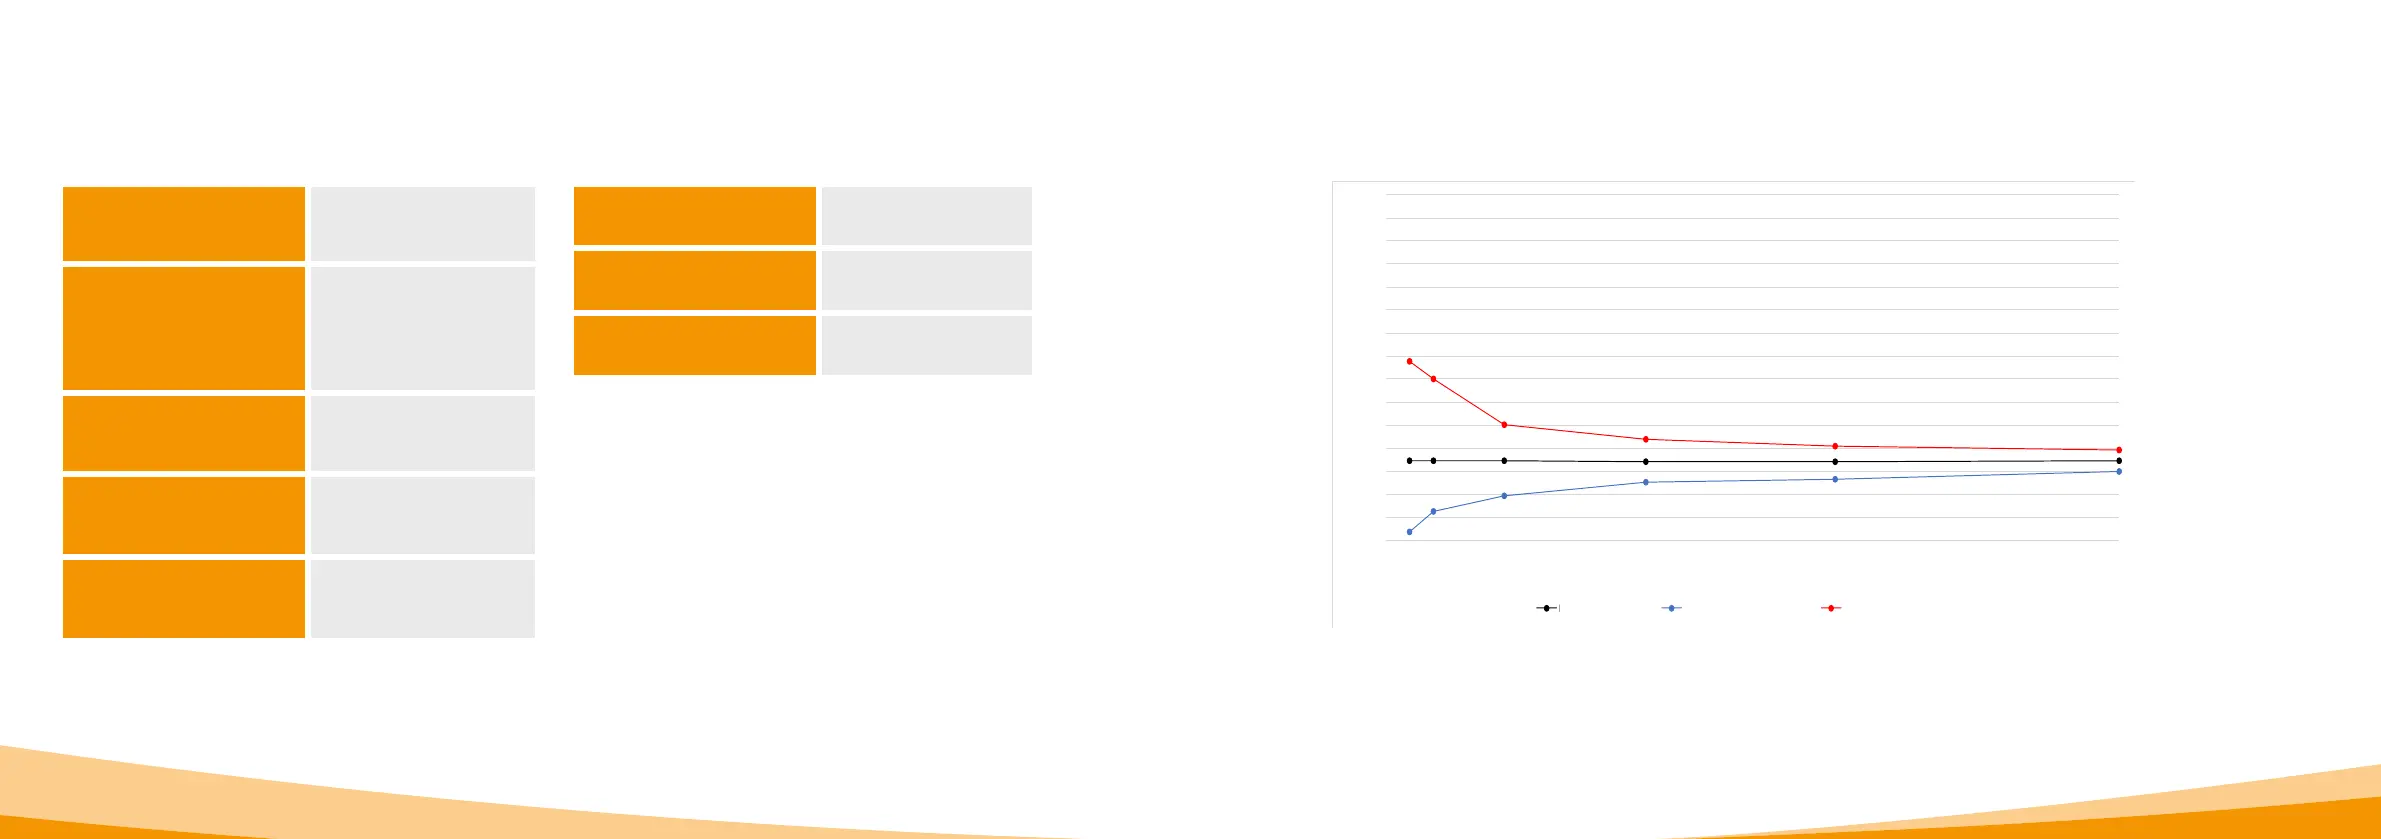
prozentualer Flussfehler[%]
Beobachtungsfenster
prozentualer Gesamtfehler maximal negative Abweichung maximal positive Abweichung
Programming of the
basal rate
Up to 5time periods over the
course of 24hours
Time periods adjustable in
increments of 30minutes
Delivery of the basal rate
The programmed profile is repeated
every day
Delivery amount 0.1to 15mg/h
Delivery at intervals of 5to 30
minutes based on the set basal
rate
Delivery precision +/‑ 5%*
Bolus delivery
Immediately upon detection of
the bolus command
Delivery rate 0.25mg/s
Precision +/‑ 5%*
Precision of delivery
(trumpet curve after end
of the stabilising phase)*
Page 157
Start‑up diagram
(delivery during the
stabilising phase)*
Page 158
Reservoir warning time
1to 8hours
adjustable in increments of
1hour
Bolus dose
0.0to 10mg
adjustable in increments of
0.1mg
Bolus lock
Number of boluses: 0to 20
per time period: 6h to 24h
Lockout time: 15min to 90min
10.4
DRUG DELIVERY
10.5
SETTINGS
TRUMPET CURVE
Equipment and conditions:
‑ Delivery rate 4.8mg/h
‑ Orbit administration set
‑ Ambient conditions: 22
°C, unregulated relative humidity
-3
-2.8
-2.6
-2.4
-2.2
-2
-1.8
-1.6
-1.4
-1.2
-1
-0.8
-0.6
-0.4
-0.2
0
0 1 2 3 4 5 6 7 8 9 10 11 12 13 14 15 16 17 18 19 20 21 22 23 24 25 26 27 28 29 30 31
prozentualer Flussfehler[%]
Beobachtungsfenster
prozentualer Gesamtfehler maximal negative Abweichung maximal positive Abweichung
Total error in percent
-3
-2.8
-2.6
-2.4
-2.2
-2
-1.8
-1.6
-1.4
-1.2
-1
-0.8
-0.6
-0.4
-0.2
0
0 1 2 3 4 5 6 7 8 9 10 11 12 13 14 15 16 17 18 19 20 21 22 23 24 25 26 27 28 29 30 31
prozentualer Flussfehler[%]
Beobachtungsfenster
prozentualer Gesamtfehler maximal negative Abweichung maximal positive Abweichung
Maximum negative deviation
-3
-2.8
-2.6
-2.4
-2.2
-2
-1.8
-1.6
-1.4
-1.2
-1
-0.8
-0.6
-0.4
-0.2
0
0 1 2 3 4 5 6 7 8 9 10 11 12 13 14 15 16 17 18 19 20 21 22 23 24 25 26 27 28 29 30 31
prozentualer Flussfehler[%]
Beobachtungsfenster
prozentualer Gesamtfehler maximal negative Abweichung maximal positive Abweichung
Maximum positive deviation
Viewing window
Flow error in percent [%]
*As measured according to the EN 60601‑2‑24standard