104
Eversense XL CGM User Guide
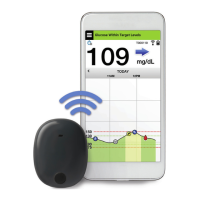
Glucose Pie Chart
This report shows in graphical format what percent of your readings
within a given time period are within, below or above your Glucose
Target levels. You can choose the last 1, 7, 14, 30 or 90 days.
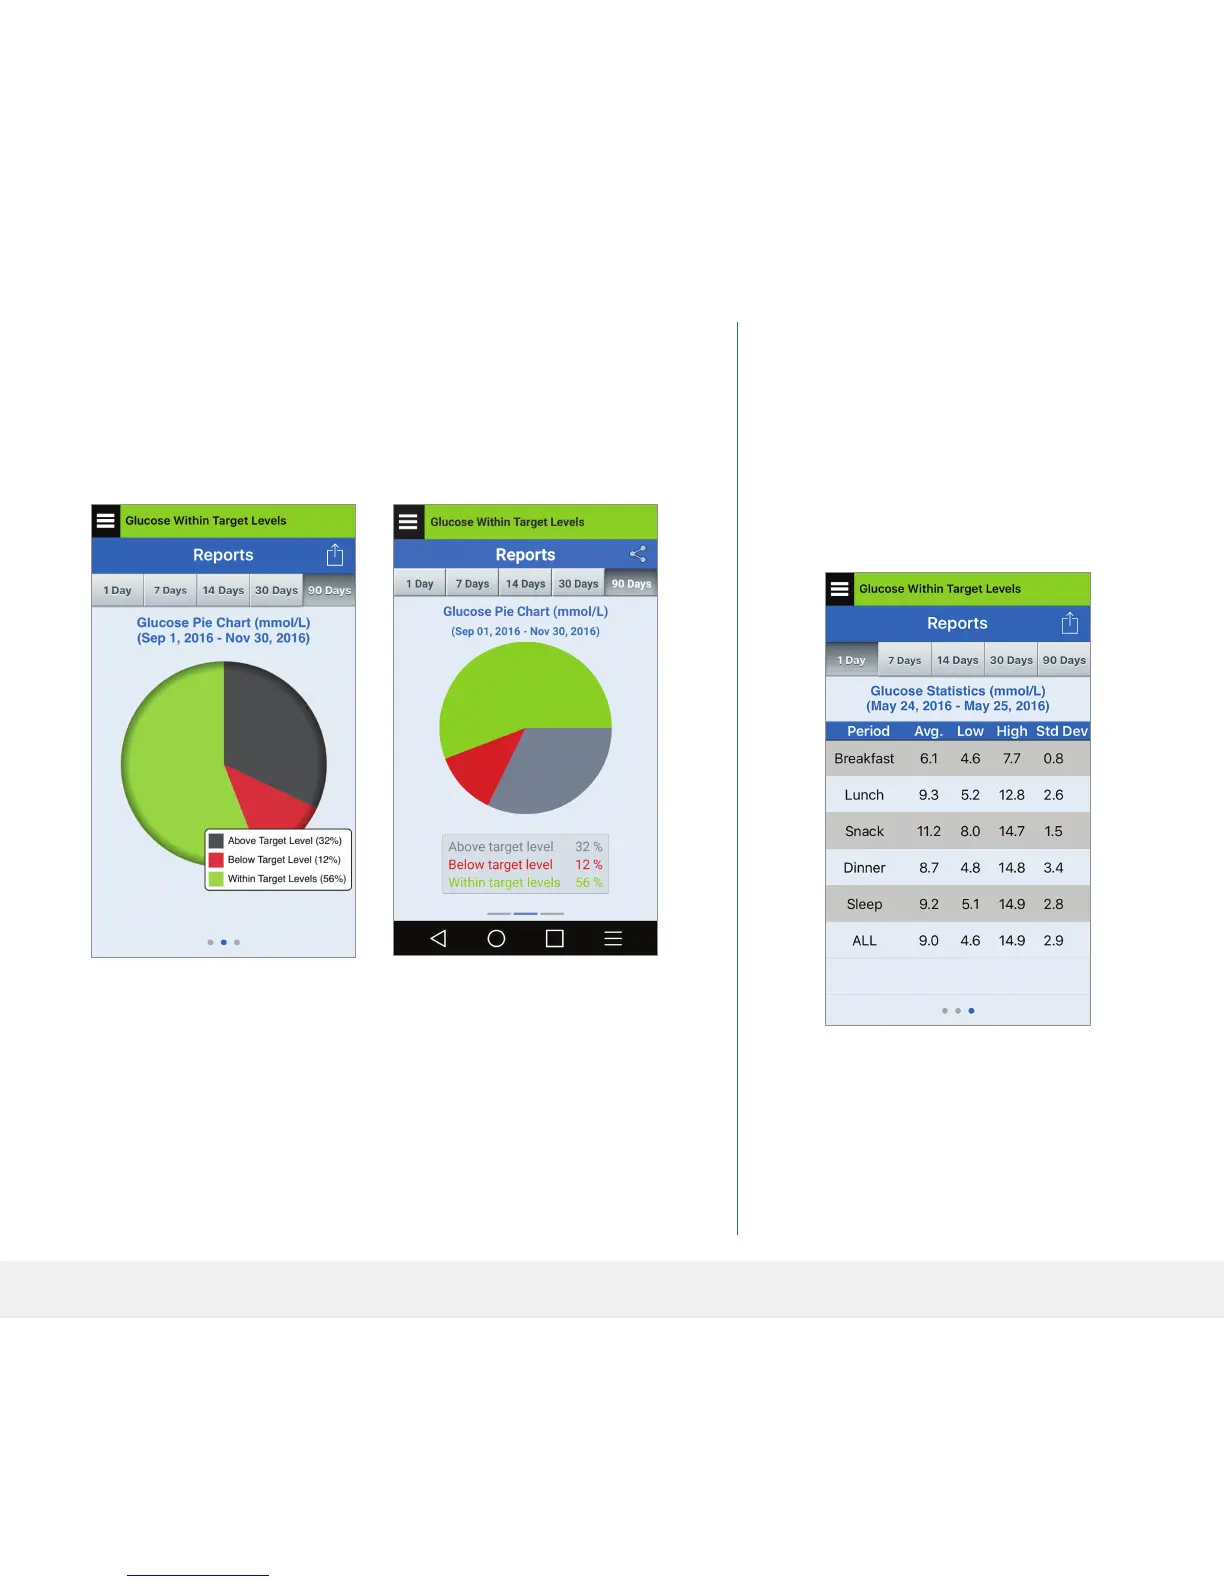
Glucose Statistics
This report shows your average,
low and high glucose readings, along
with standard deviation within a
mealtime slot period. You can choose
the last 1, 7, 14, 30 or 90 days.
iOS Android