134
Eversense XL CGM User Guide
18
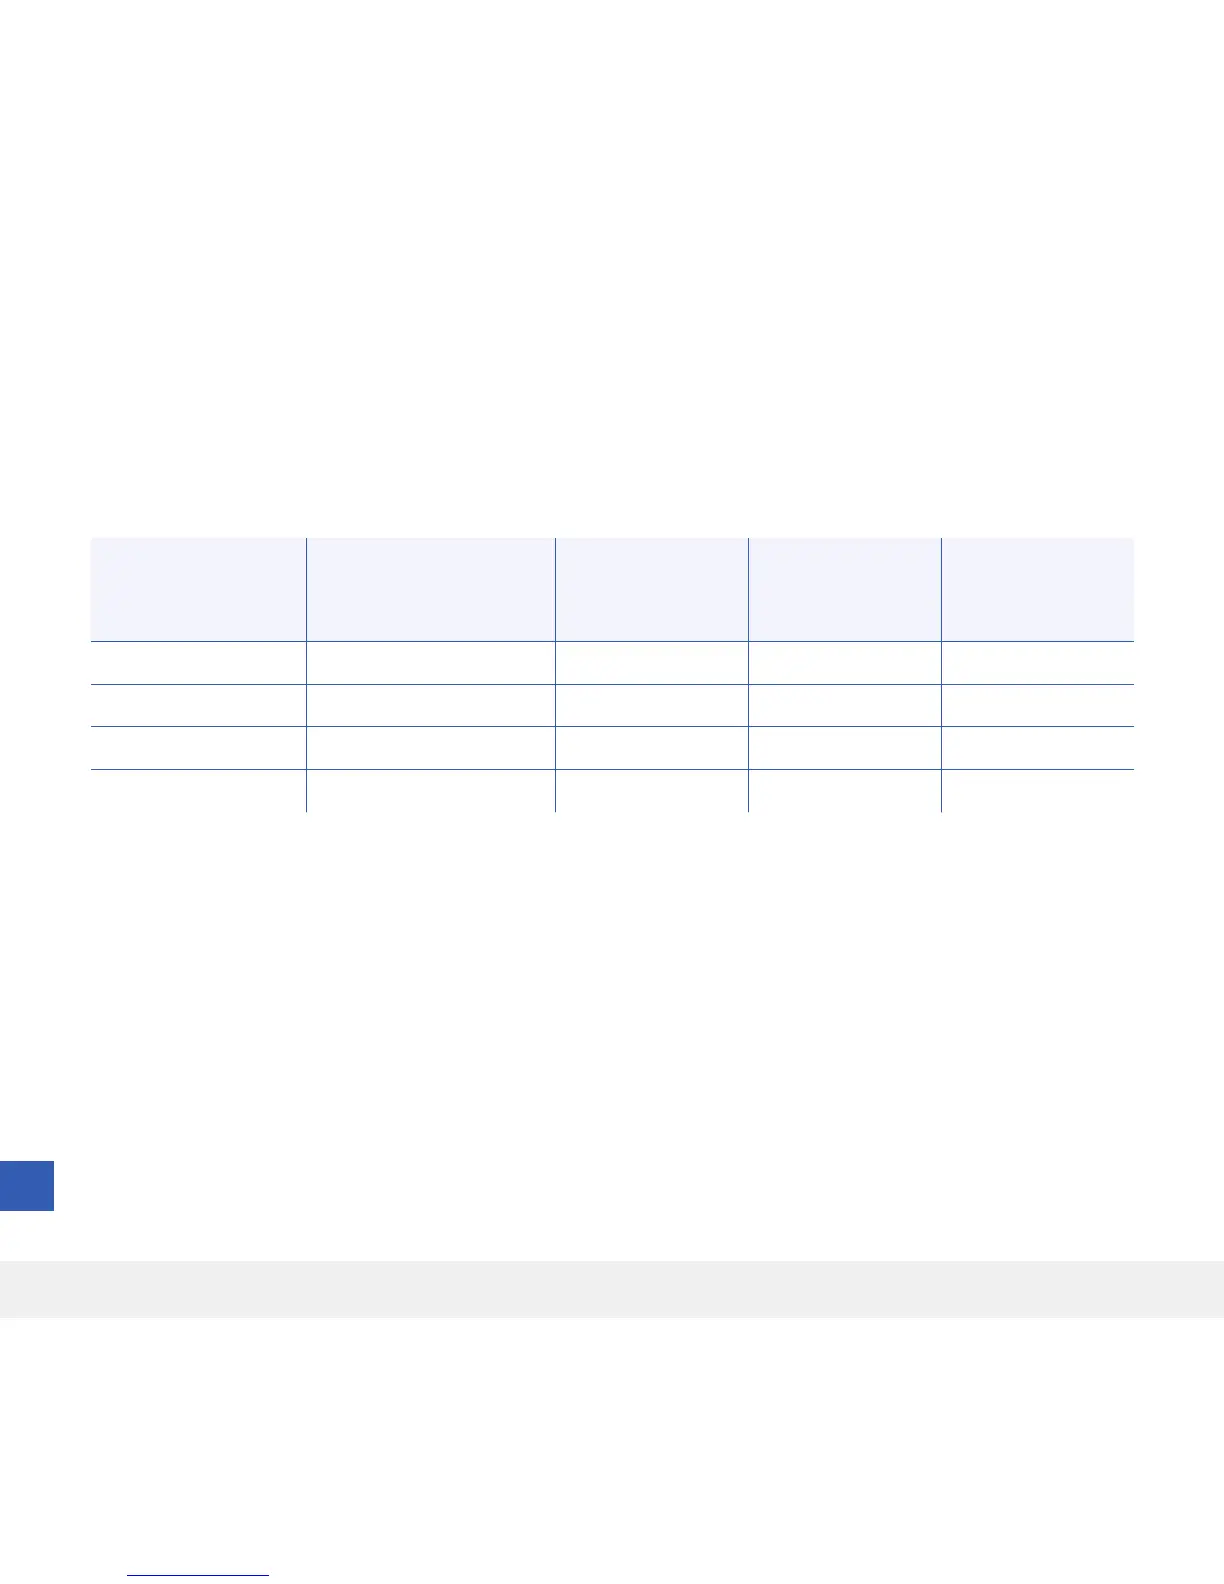
Overall System Performance Compared to YSI
The study demonstrated that 84.4% of overall CGM System readings were within ± 20% of YSI values, 94.3% were
within ± 30% of YSI values, and 97.6% were within ± 40% of YSI values. The chart below provides a percentage
breakdown by glucose range.
Dierence between CGM System readings and YSI Measurements by Glucose Level
YSI Glucose
Range
(mmol/L)
Number of paired
CGM-YSI
Readings
Percent
within
20% of YSI
Percent
within
30% of YSI
Percent
within
40% of YSI
≤ 3.9* 632 78.3% 90.2% 94.5%
3.9 - 10.0 14699 81.8% 93.0% 97.0%
> 10.0 6196 91.3% 97.7% 99.3%
Overall 21527 84.4% 94.3% 97.6%
*The absolute dierence from the YSI reading is measured in mmol/L if the YSI reading is ≤ 3.9 mmol/L.
Although device measurement errors may have been present in either YSI or sensor readings, and interstitial values
(sensor) are known to have time lags in responses to changing glucose levels compared to blood values (YSI), it
was demonstrated that 80% or greater of dierences were within 20%/1.1 mmol/L (20% for YSI values greater than
3.9 mmol/L, within 1.1 mmol/L for YSI values ≤ 3.9 mmol/L). The level of agreement increased to above 90% for
dierences within 30%/1.7 mmol/L and above 95% for dierences within 40%/2.2 mmol/L.