112
Eversense XL CGM User Guide
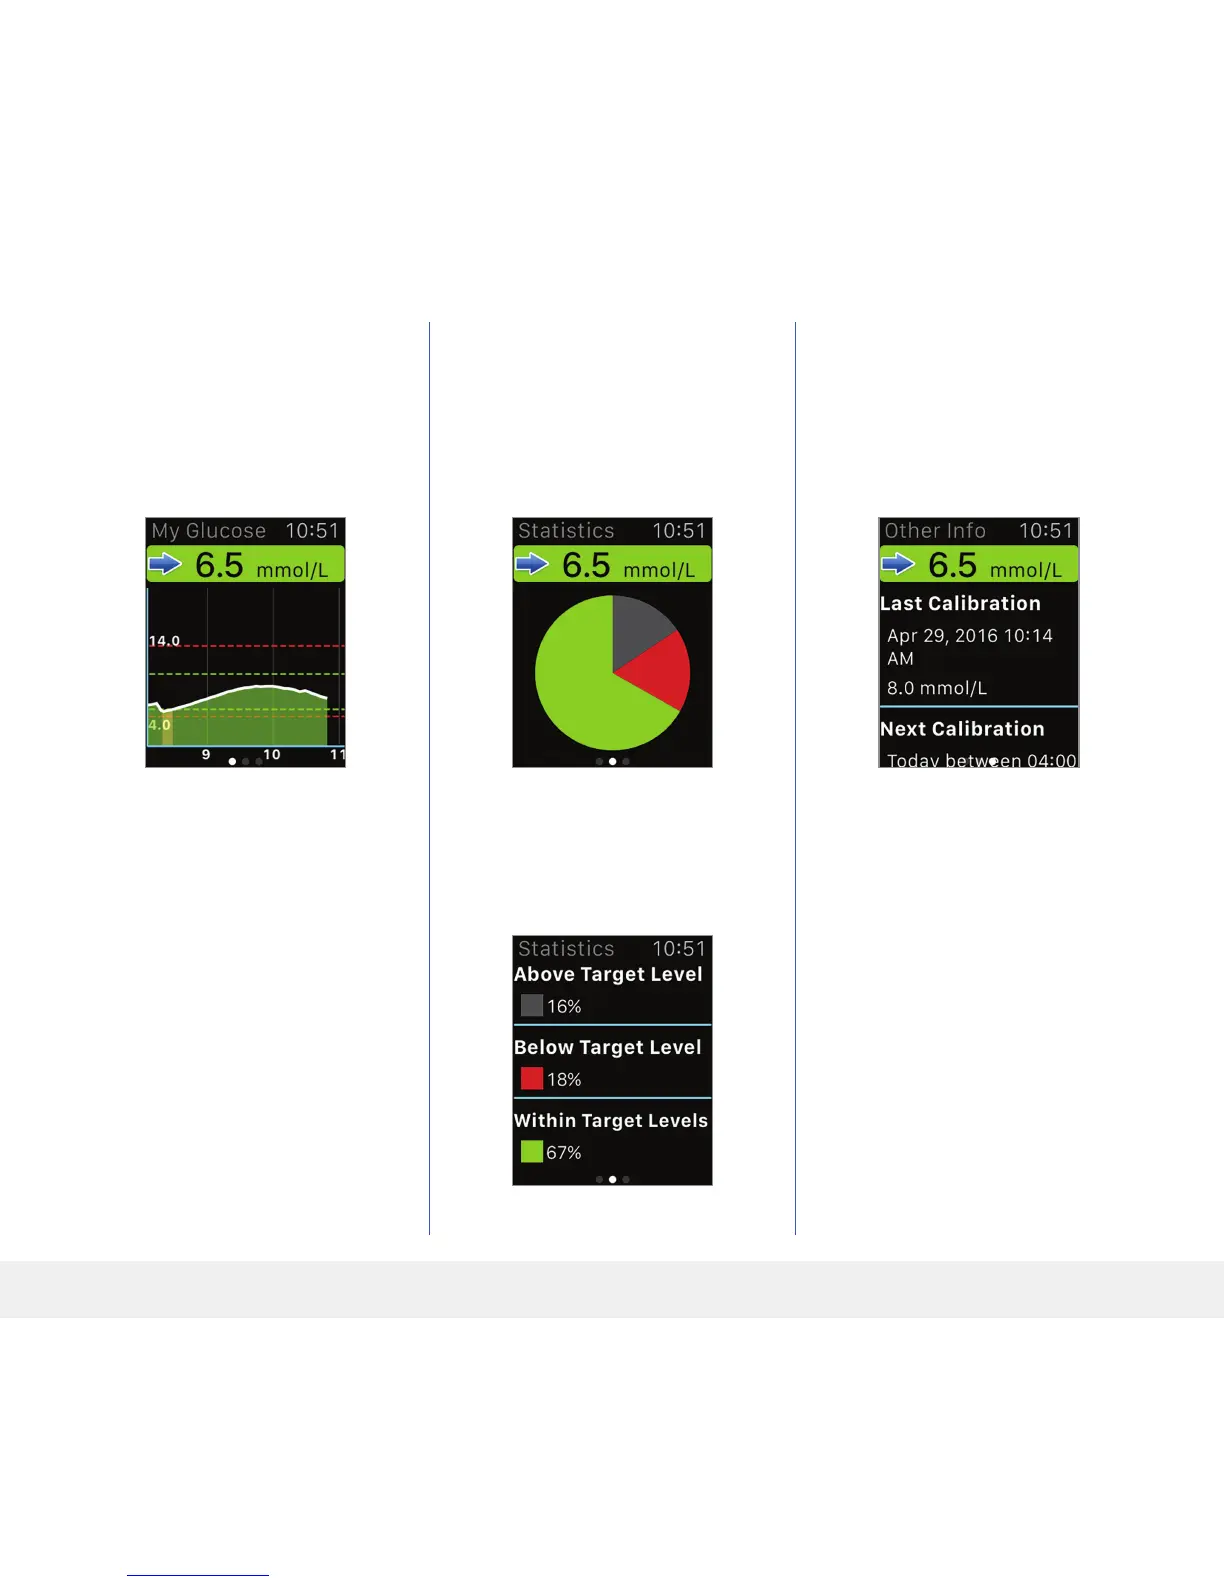
Swipe left to the next screen
showing a pie chart of your total
time within and outside your target
range for the past 24 hours.
Swipe up to display the same data
shown as percentages.
Swipe left to the next screen
showing your current glucose with
trend arrow, your next scheduled
calibration time, and the current
system calibration phase.
The My Glucose screen shows
your current glucose with trend
arrow, and a trend graph of your
last three hours of CGM data.