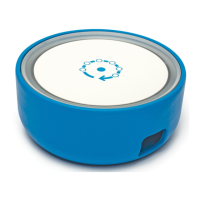
Fingbox - This is the Fingbox command center, also called the Dashboard
. Here you can see
who’s at home now, important security warnings, see the events happened while you weren’t
watching and tools to troubleshoot your wifi and network problems.
Look at the Dashboard section of this manual for a description of all its screen elements.
Because this is the most important screen, we’ll start right from here.
Fingbox Dashboard
The Fingbox Dashboard has multiple sections. They keep information easy to find for you.
Dashboard sections
People
At the top of the screen you can see your family members. A grayed out icon means they are
not at home (or at least, their personal device is offline).
A small number under the face tells you how long ago their state changed (i.e. they left home
or came back).
Tap on a face to see the owned devices, pause the Internet access for this person’s devices or
change anything about the person.
Attention required
Right under the people section, there is a recap of the global status (green or yellow shield) and
how many devices are currently online. This area is where important notifications appear
requiring for your immediate action. For example, when a new device is detected the notification
will stay here until you take an action or simply acknowledge.
On the right there is a button to access all the past events that happened in your network.
Tests and reports
In this section you have the “tiles” reporting the latest results from tools and checks such as
Wi-Fi performance, Internet speed, DigitalFence, bandwidth usage analysis and Internet
security. Tap on a tile to access the corresponding tool, test or report.
Paused and Blocked devices
This section appears whenever a device or a person have been restricted access to the Internet
(PAUSE) or to the whole network (BLOCK). Here you can quickly review the restricted devices
and easily unpause or unblock them.
Fingbox User’s Guide - App v6.2.1 Page 10

 Loading...