Calibration
Introduction 5
5-13
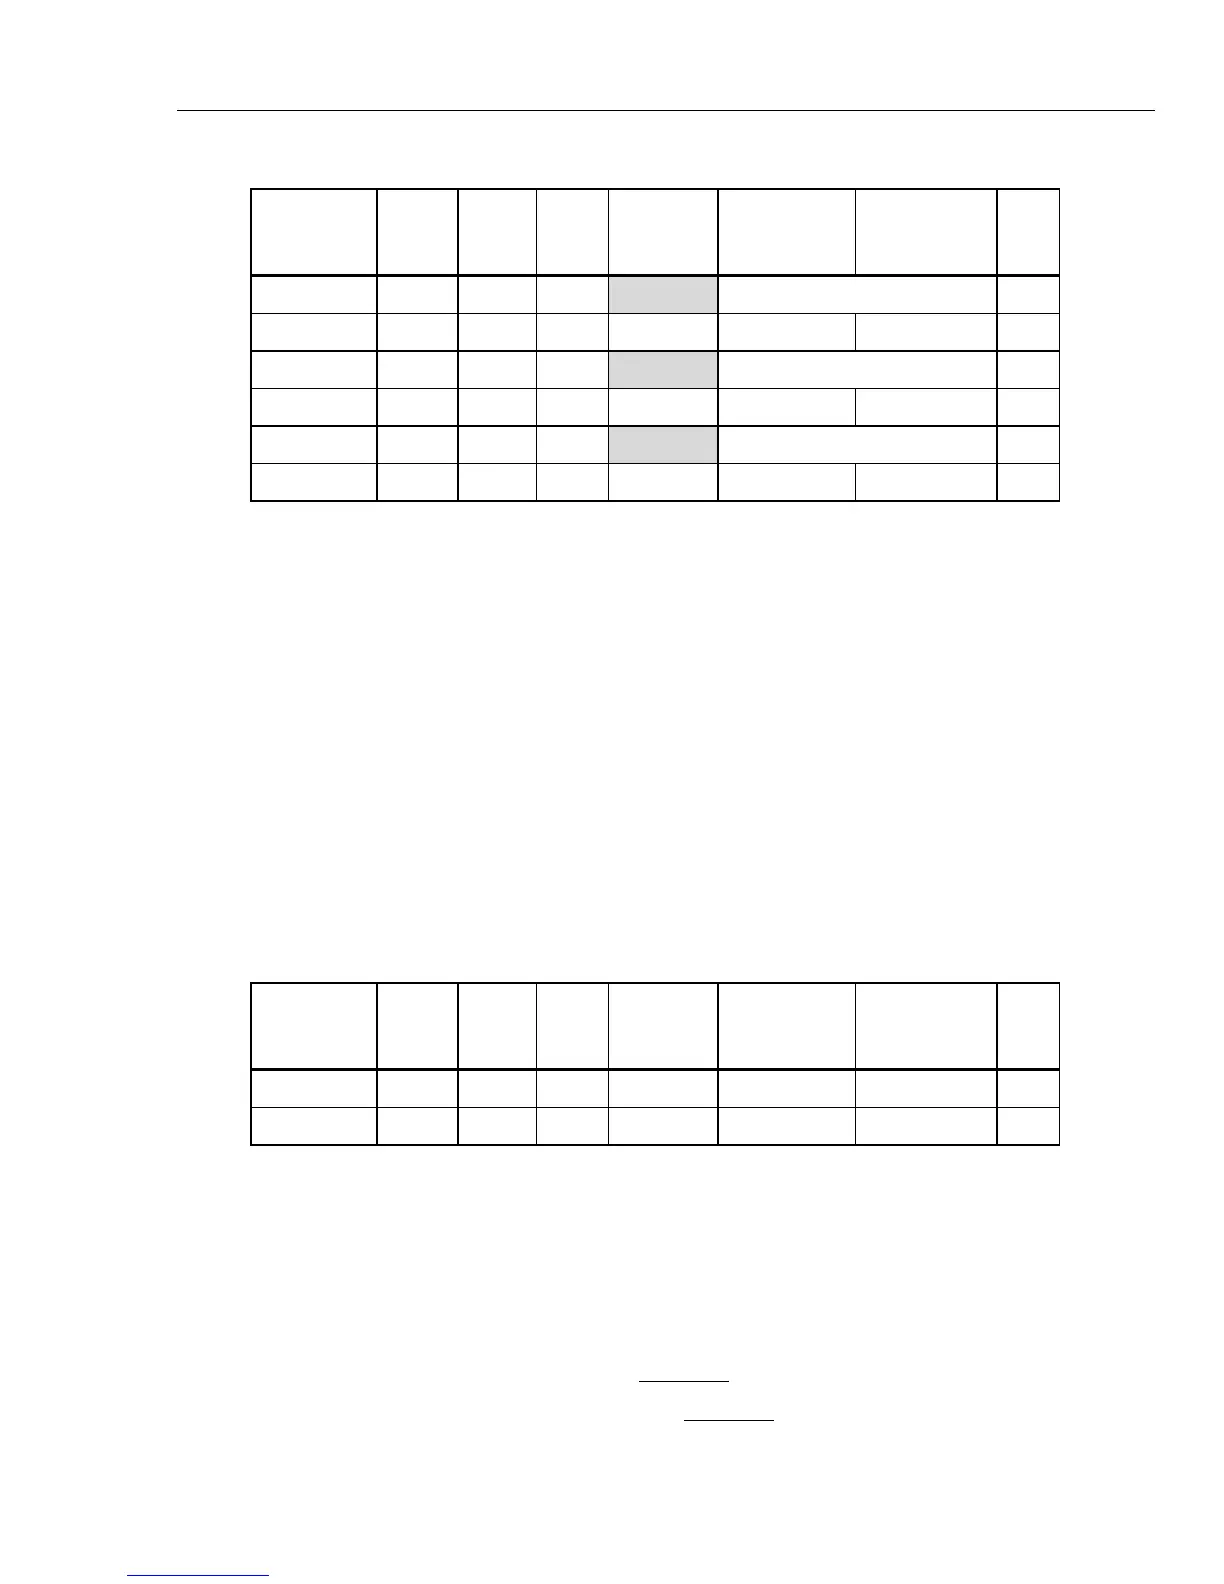
Table 5-5. 120 Amp Range Verification Points (cont.)
5720A
Output
8508A
ACV
filter
8508A
Input
A40B
Measured
Error (%)
Product
Specification
(99 %)
Measurement
uncertainty
(99 %)
TUR
0.8 V, 3 kHz 100 Rear 100 A - Reference level
1 V, 3 kHz 100 Front 100 A ±0.6000 % ±0.0117 % >25:1
0.8 V, 6 kHz 100 Rear 100 A - Reference level
1 V, 6 kHz 100 Front 100 A ±1.5400 % ±0.0117 % >25:1
0.8 V, 10 kHz 100 Rear 100 A - Reference level
1 V, 10 kHz 100 Front 100 A ±4.9000 % ±0.0117 % >25:1
Current Input Burden Resistor Verification
1. Push S on the Product and 5720A.
2. Push B on the Product.
3. Push A on the Product.
4. Set the output of the 5720A to +200 mA.
5. Push M on the 5720A.
Note
The rear input connection to the DMM is not necessary for this verification.
6. Set the DMM ‘m’ store to the 2 A shunt correction factor.
7. Set the DMM ‘-c’ and ‘÷z’ stores to 0.8.
8. Turn on the ‘*m’, ‘-c’ and ‘÷z’, and % math functions on the DMM.
9. Set the 5720A output to the values in Table 5-6 and record the measured error.
Table 5-6. Burden Resistor Verification Points
5720A
Output
8508A
ACV
filter
8508A
Input
A40B
Measured
Error (%)
Product
Specification
(99 %)
Measurement
uncertainty
(99 %)
TUR
200 mA dc - Front 2 A ±0.0150 % ±0.0058 % 2.6:1
-200 mA dc - Front 2 A ±0.0150 % ±0.0058 % 2.6:1
Amplitude Specification Limits, Pass/Fail Analysis
Where the Test Uncertainty Ratio (TUR) of the measurements in Tables 5-3 through 5-6
is more than 4:1, the test results show a pass if they are not more than the product
specification limits. The product specification and the measurement uncertainty are
expressed with 99 % confidence level. This implies a normal distribution. If a more
rigorous analysis is necessary, use a statistical calculation of pass or fail.
In the formula that follows, let y be the measured value, L the specification limit, and U
the measurement uncertainty.
The specification is meet when y <
L
– U
The specification is exceeded when y >
L
– U