IDA-4 Plus
Operators Manual
3-18
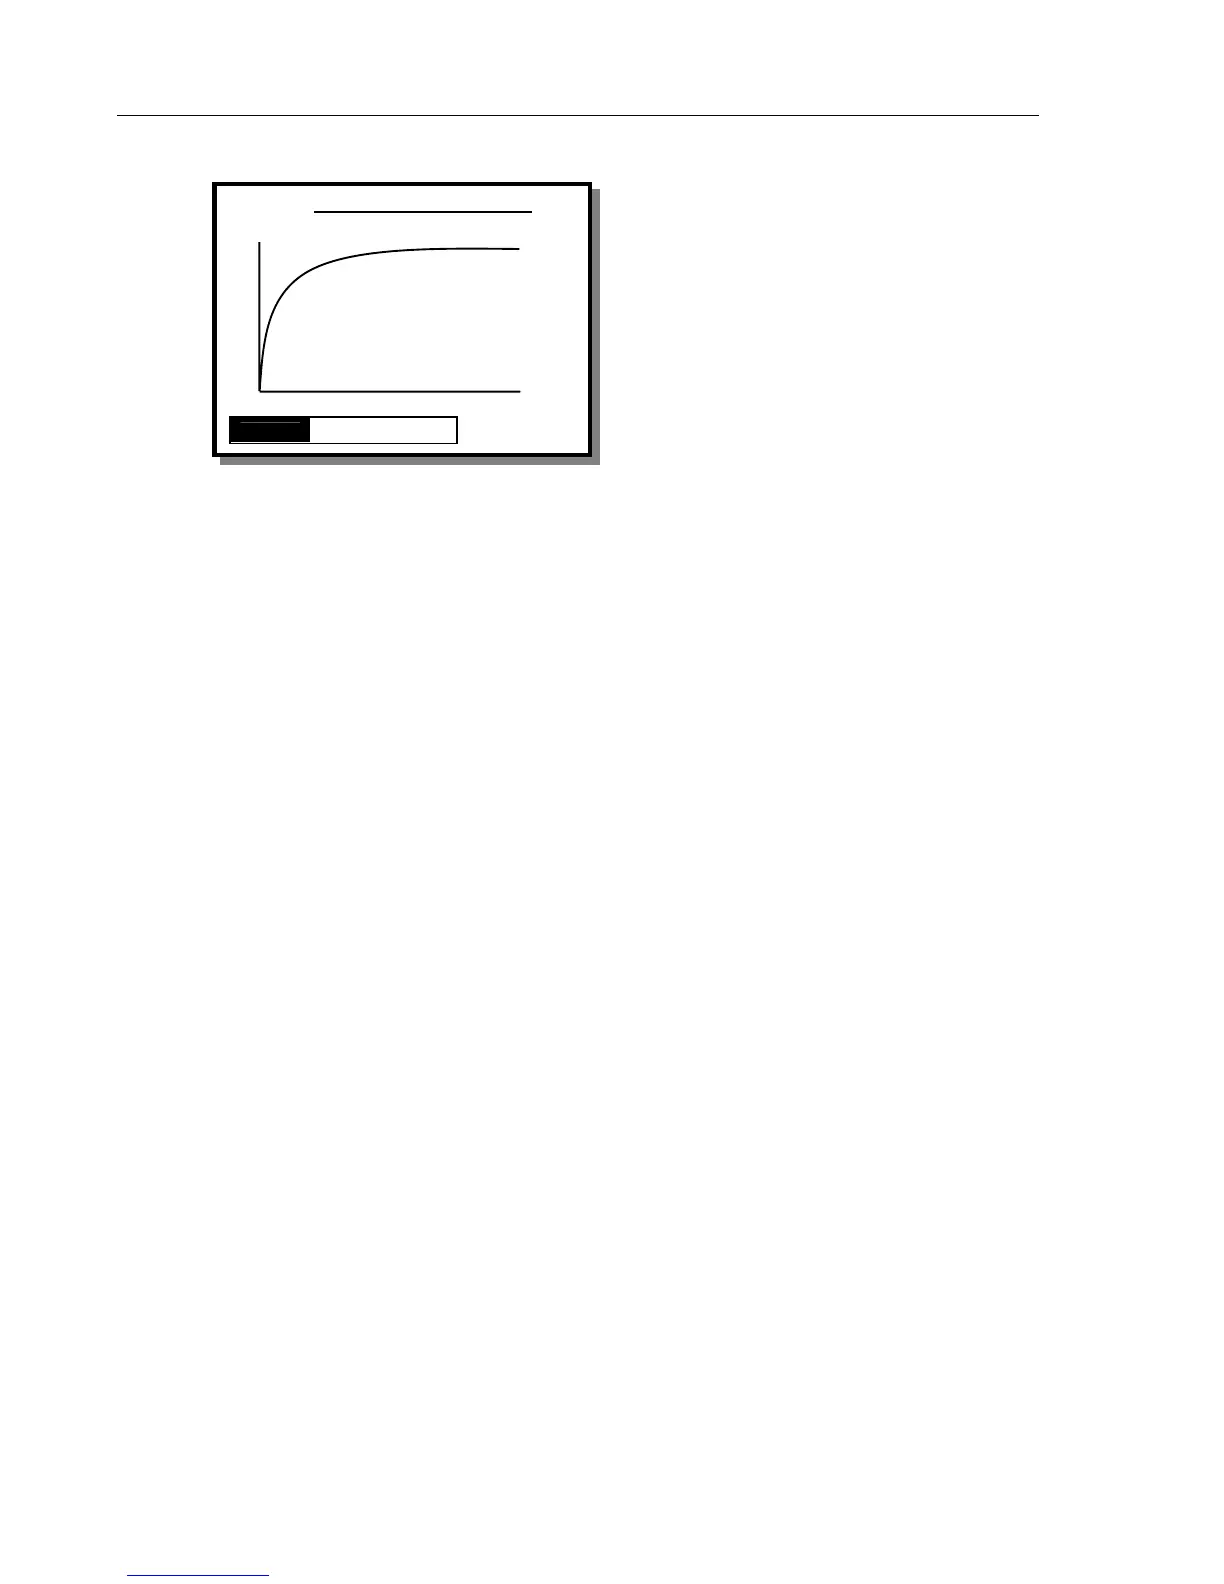
Flow Graph Screen
The FLOW GRAPH screen shown displays the
average flow rate as a continuous line and instantaneous
flow rate as a dashed line. A view of the Average,
Instantaneous or both lines is available by selecting
MODE from the menu.
Average flow rate, Latest Flow rate (instantaneous),
Delivered Volume (T) and Time are displayed to the
right of the graph. Two dashed lines represent
±
percentage deviation marks. The percentage can be set
from the TEST PARAMETERS SCREEN.
Status
This switches to the STATUS ALL CHANNELS
screen to allow the operator to use another channel or
change settings via the UTILITIES menu.
View
This returns to the FLOW TEST screen in either the
Measuring Mode or the End of Test Mode, depending
on which mode this screen was called from.
CHANNEL 1 FLOW GRAPH
Avg
Avg
70.00
ml /h
I Flow
75.20
ml /h
T Vol
15.00
ml
13: 40: 00
STATUS VIEW MODE