Color Gauges and Running Dynamics Data
The running dynamics screens display a color gauge for the primary metric. You can display cadence, vertical
oscillation, ground contact time, ground contact time balance, or vertical ratio as the primary metric. The color
gauge shows you how your running dynamics data compare to those of other runners. The color zones are
based on percentiles.
Garmin has researched many runners of all different levels. The data values in the red or orange zones are
typical for less experienced or slower runners. The data values in the green, blue, or purple zones are typical
for more experienced or faster runners. More experienced runners tend to exhibit shorter ground contact times,
lower vertical oscillation, lower vertical ratio, and higher cadence than less experienced runners. However, taller
runners typically have slightly slower cadences, longer strides, and slightly higher vertical oscillation. Vertical
ratio is your vertical oscillation divided by stride length. It is not correlated with height.
Go to garmin.com/runningdynamics for more information on running dynamics. For additional theories and
interpretations of running dynamics data, you can search reputable running publications and websites.
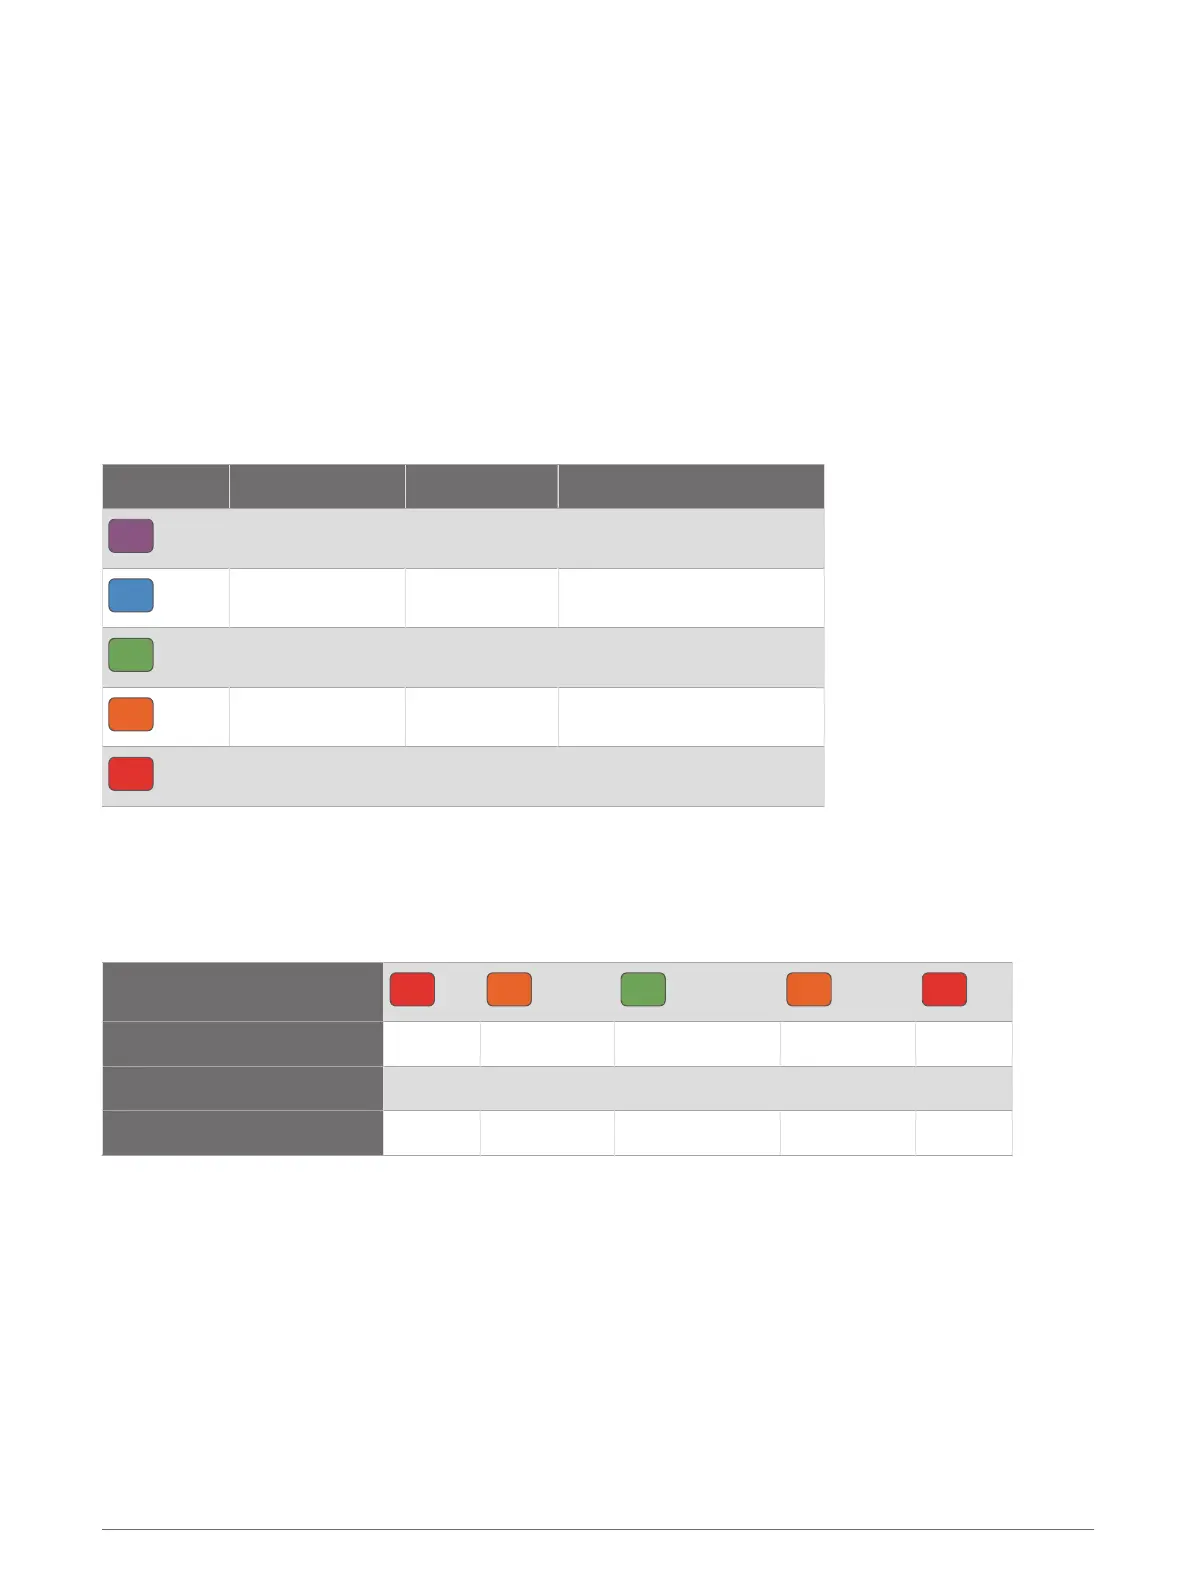
Color Zone Percentile in Zone Cadence Range Ground Contact Time Range
Purple
>95 >183spm <218ms
Blue
70–95 174–183spm 218–248ms
Green
30–69 164–173spm 249–277ms
Orange
5–29 153–163spm 278–308ms
Red
<5 <153spm >308ms
Ground Contact Time Balance Data
Ground contact time balance measures your running symmetry and appears as a percentage of your total
ground contact time. For example, 51.3% with an arrow pointing left indicates the runner is spending more time
on the ground when on the left foot. If your data screen displays both numbers, for example 48–52, 48% is the
left foot and 52% is the right foot.
Color Zone
Red Orange Green Orange Red
Symmetry Poor Fair Good Fair Poor
Percent of Other Runners 5% 25% 40% 25% 5%
Ground Contact Time Balance >52.2%L 50.8–52.2%L 50.7%L–50.7%R 50.8–52.2%R >52.2%R
While developing and testing running dynamics, the Garmin team found correlations between injuries and
greater imbalances with certain runners. For many runners, ground contact time balance tends to deviate
further from 50–50 when running up or down hills. Most running coaches agree that a symmetrical running
form is good. Elite runners tend to have quick and balanced strides.
You can watch the gauge or data field during your run or view the summary on your Garmin Connect account
after your run. As with the other running dynamics data, ground contact time balance is a quantitative
measurement to help you learn about your running form.
110 Wireless Sensors
 Loading...