8-12 ApexPro™ 2001989-200E
Viewing stored patient data
073A
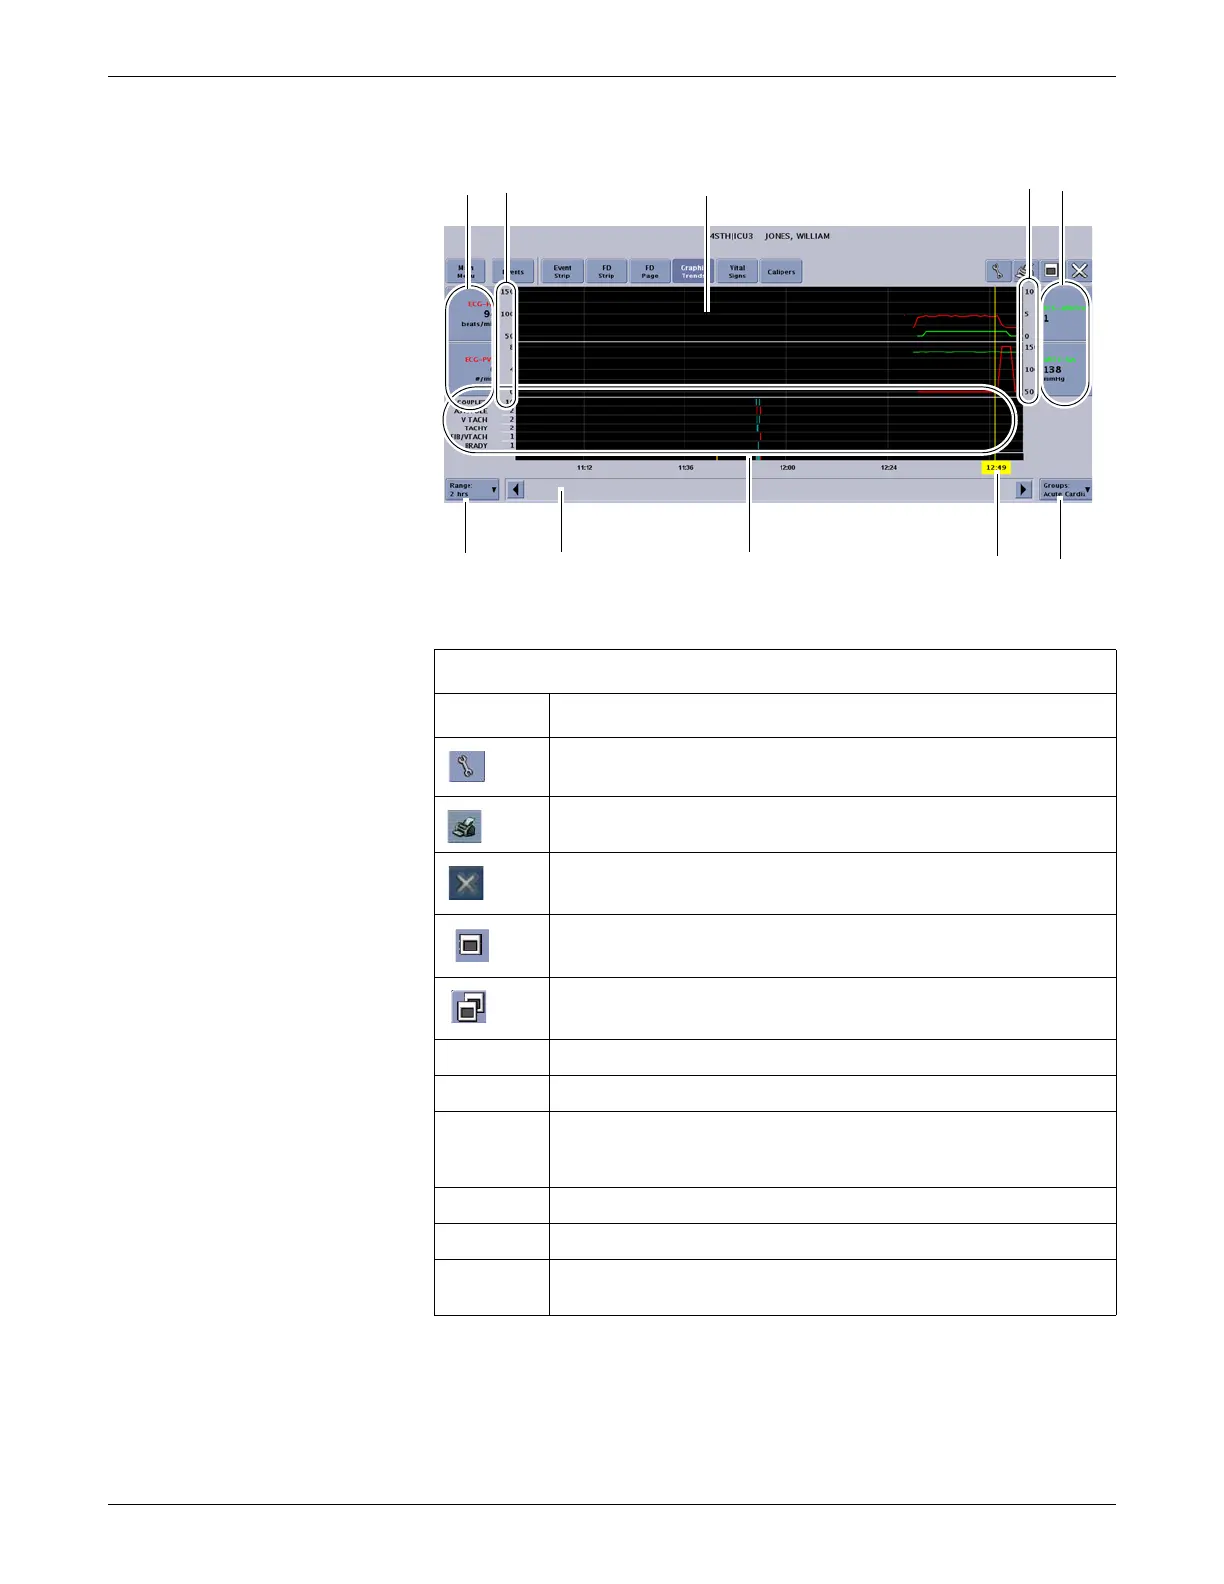
Graphic Trends window
Item Description
Tools button. Display the trend Groups configuration (view-only).
Print button. Print the displayed trends.
Close button. Close the window.
Maximize button. Use to toggle to full screen format.
Minimize button. Use to toggle to half screen format.
1 Graphic Trends window.
2 Graphic trend scales.
3 Graphic trend buttons. Identify the trended data and the associated
parameter numeric values. Click on a graphic trend button to change the
scale of this graphic trend.
4 Range. Display the selected time range from 15 minutes to 24 hours.
5 Scroll bar. Move backward or forward in time.
6 Event summary. Display a brief overview of the type and number of events
that occurred during a specific time focus.
 Loading...