E-2 MM2 Motor Manager 2
GE Power Management
E.1 CT ISOLATION APPENDIX E
E
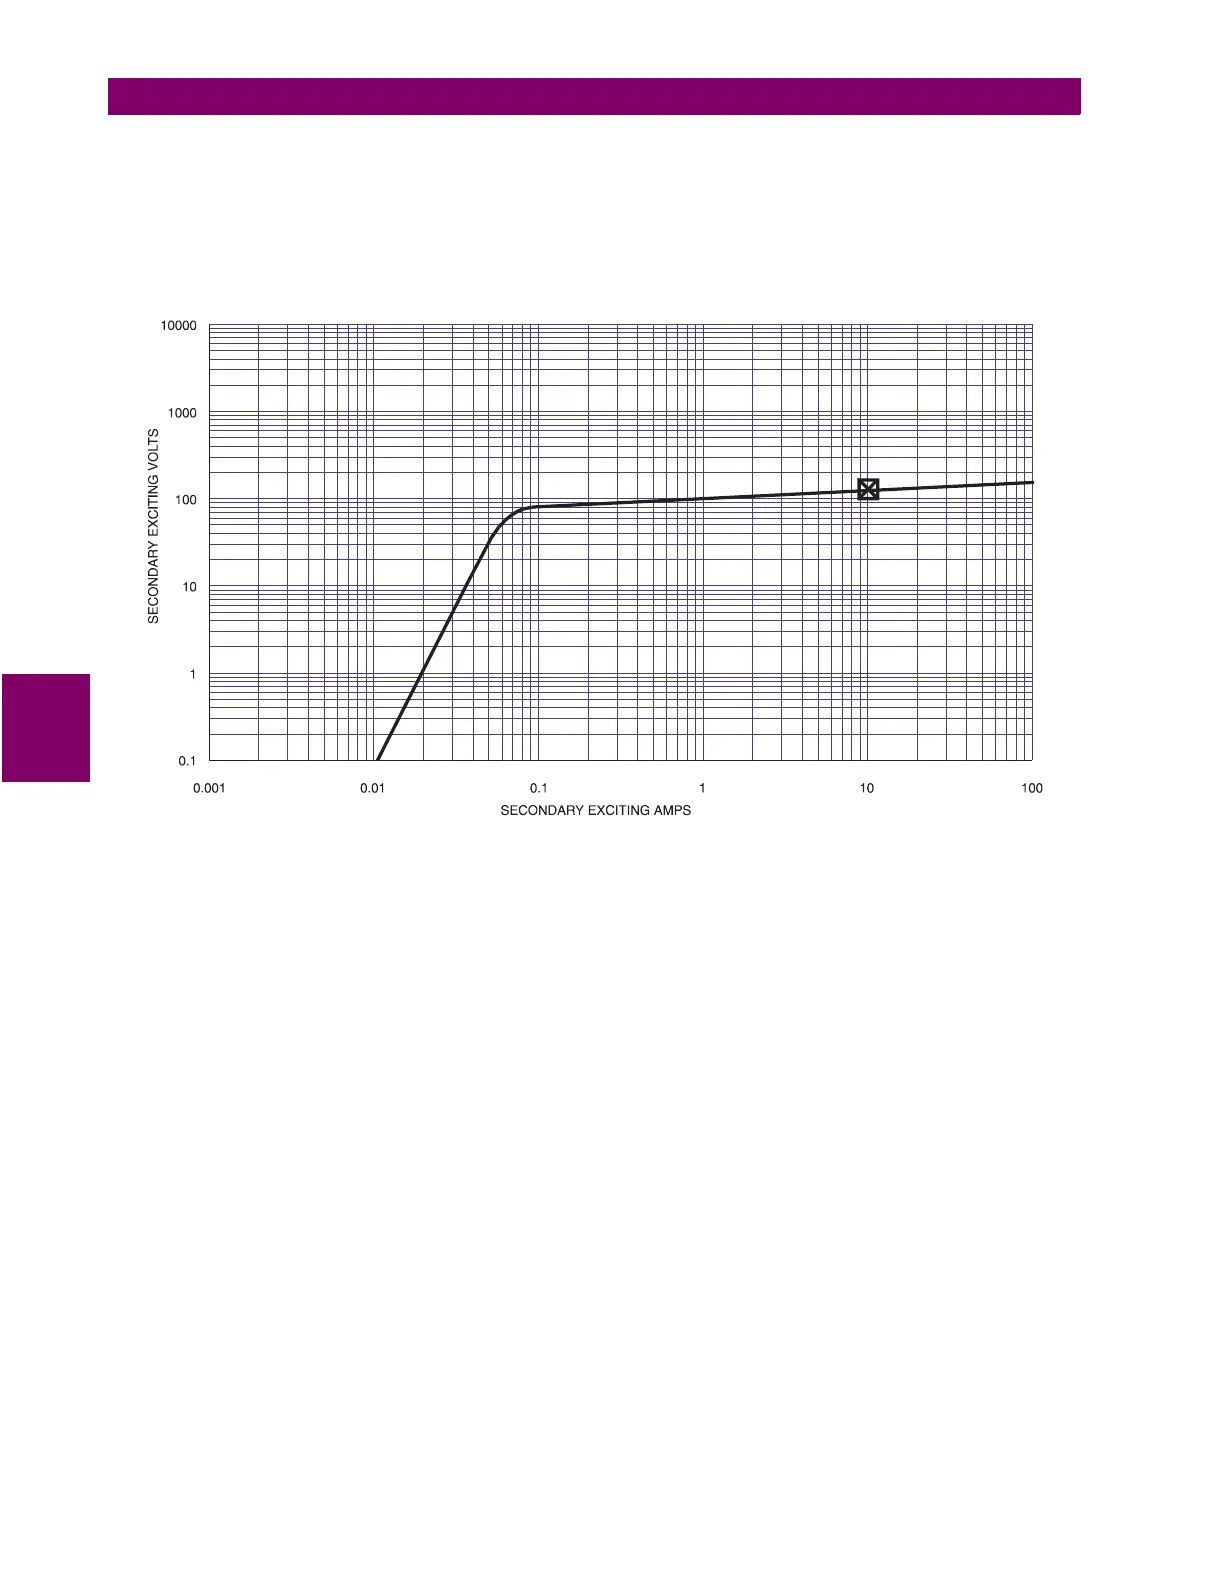
The curve below represents a typical excitation curve for a CT. The Y-axis represents secondary
exciting voltage; the X-axis represents the secondary exciting current. When the CT secondary excit-
ing voltage level is picked off the graph, the corresponding secondary exciting current is the amount
of current required to excite the core of the CT. With respect to the ideal CT that conforms perfectly to
its ratio, the exciting current could be considered loss.
Figure E–1: EXCITATION CURVES
For a Protection Class CT with a 5A secondary and maximum 10% ratio error correction, it is proba-
ble that the design point for 20 times rated secondary will be at or slightly lower than the 10 A sec-
ondary exciting current point (10% of 20
×
5 A). To design such that the 20 times rated secondary
current is in the linear region would be more expensive.
In order to determine how much current CTs can output, the secondary resistance of the CTs is
required. This resistance will be part of the equation as far as limiting the current flow. This is deter-
mined by the maximum voltage that may be developed by the CT secondary divided by the entire
secondary resistance, CT secondary resistance included.
The easiest method of evaluating a CT is by the Excitation Curves Method, as illustrated by the
curves shown below. The Y-axis represents secondary exciting voltage; the X-axis represents the
secondary exciting current. These curves may be obtained from the CT manufacturer, or by experi-
mentation (see ANSI/IEEE C57.13.1 for procedures). The curves illustrate the values of secondary
volts for which the output of the CT will be linear. The desired operating secondary voltage is below
the kneepoint (A or B on the graph (ANSI or IEC respectively) or just slightly above it, staying within
10% CT ratio error correction at 20 times rating. Using this information, it is important to recognize
that the secondary exciting voltage is the total voltage that the CT can develop at the secondary. In
this case, that voltage will drop across the secondary winding resistance as well as any load that is
applied to the unit. Therefore, the secondary winding resistance must always be included with the
excitation curves, or the information is incomplete.
 Loading...