-23-
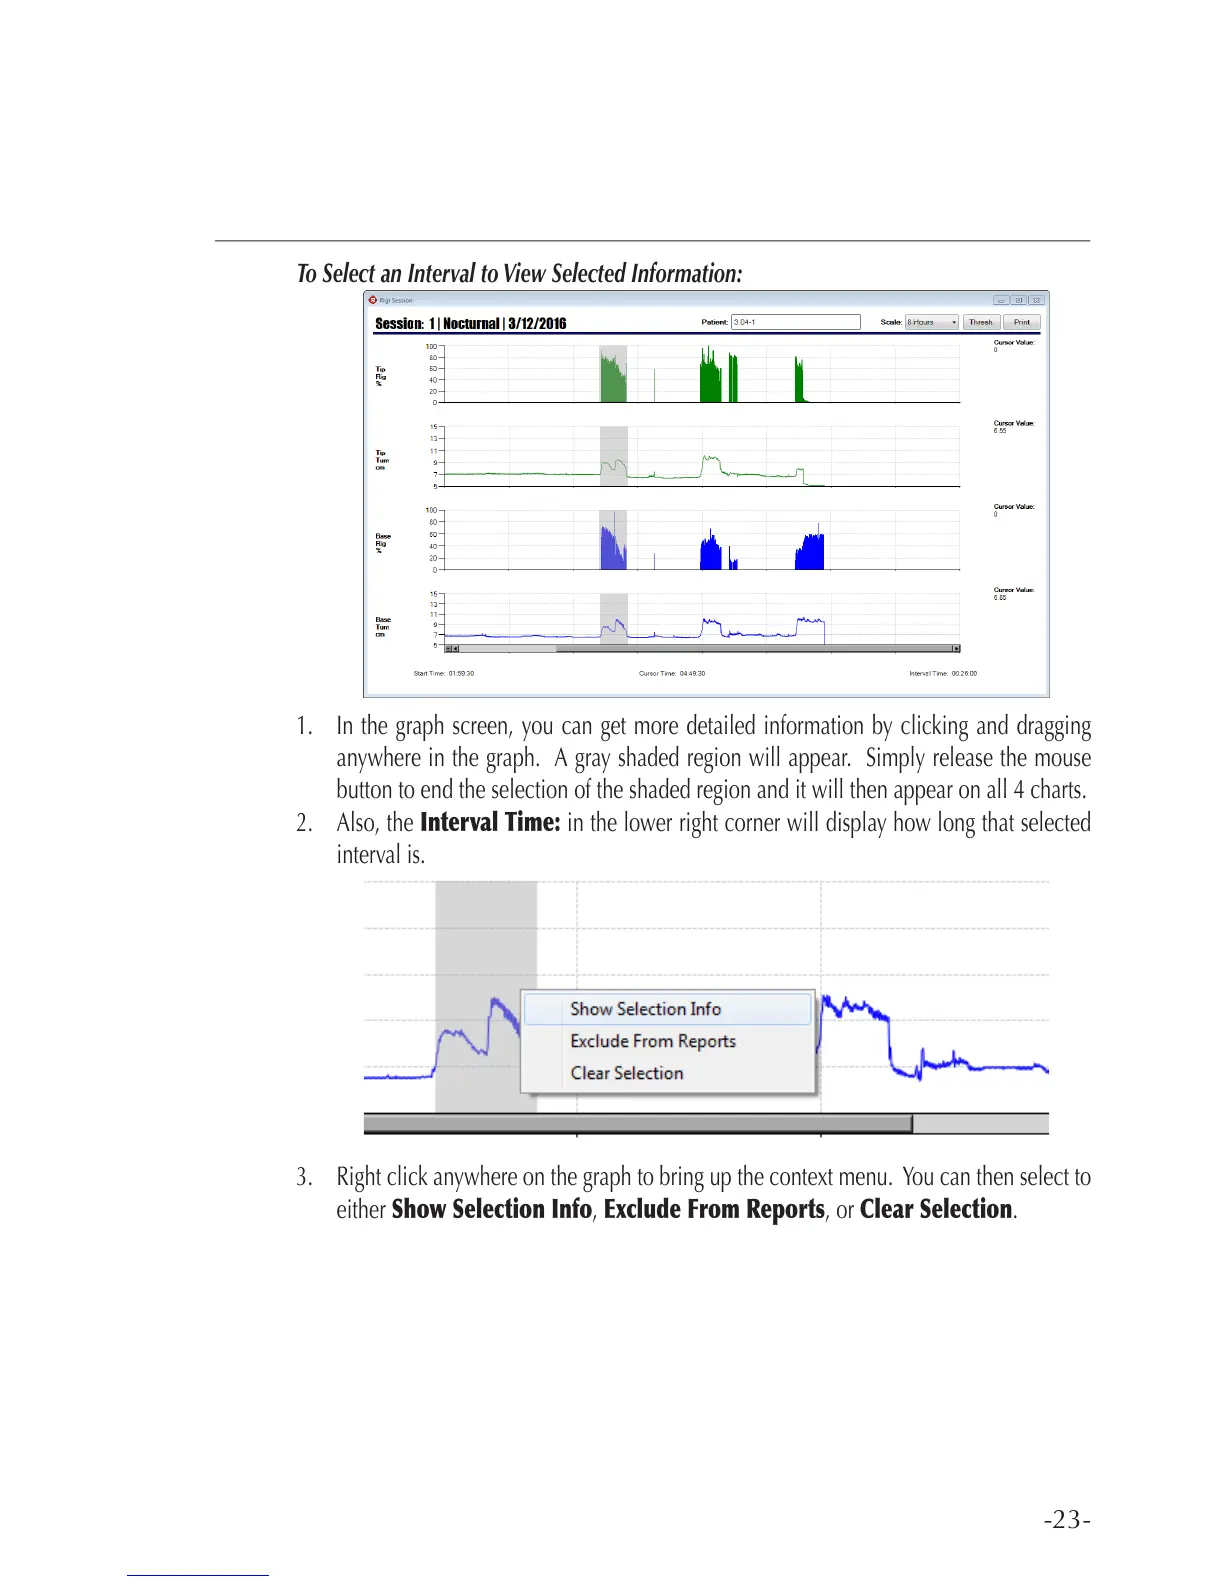
To Select an Interval to View Selected Information:
1. In the graph screen, you can get more detailed information by clicking and dragging
anywhere in the graph. A gray shaded region will appear. Simply release the mouse
button to end the selection of the shaded region and it will then appear on all 4 charts.
2. Also, the Interval Time: in the lower right corner will display how long that selected
interval is.
3. Right click anywhere on the graph to bring up the context menu. You can then select to
either Show Selection Info, Exclude From Reports, or Clear Selection.