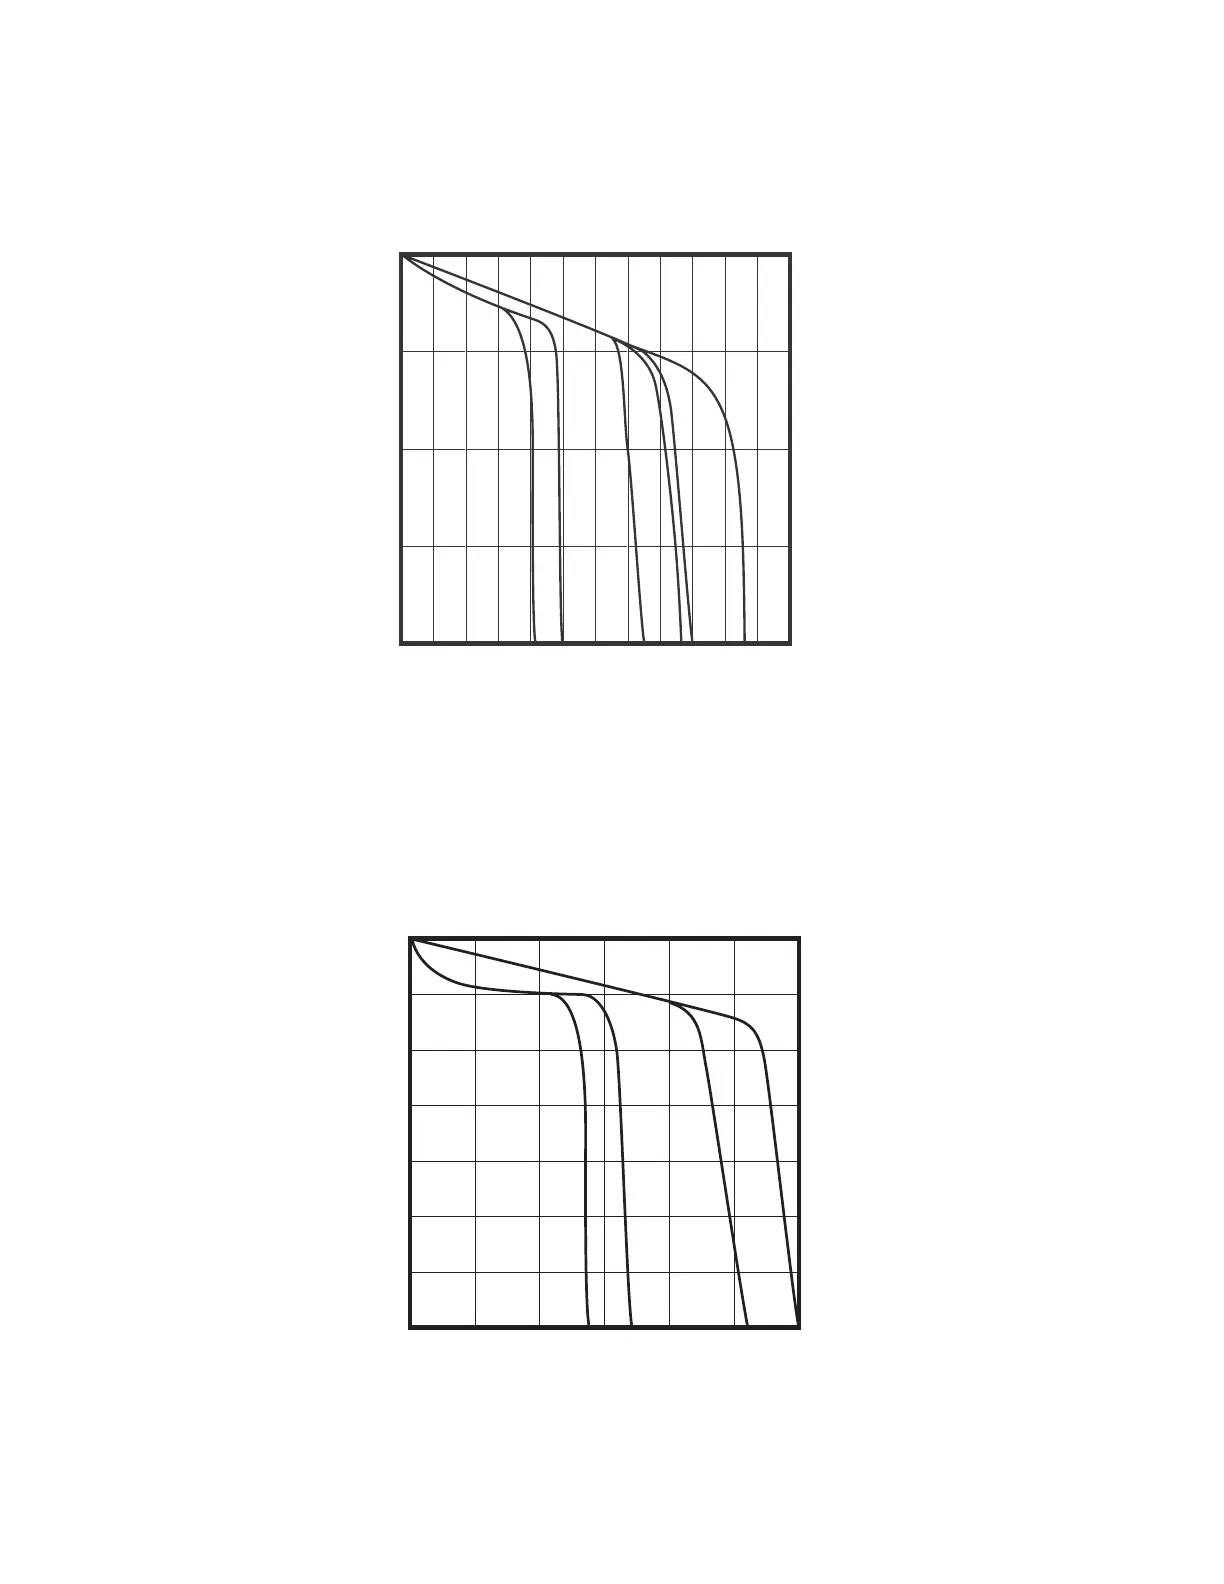
Performance Charts
46
Performance Charts
Coatings Performance Chart
Foam Performance Chart
Flow Rate in lb/min (kg/min)
Pressure in psi (MPa, bar)
Pressure in psi (MPa, bar)
Flow Rate in gal/min (liter/min)
0
0
0.5
1.0 1.5
2.0 2.5 3.0
(1.9) (3.8) (5.7)
(7.6) (9.5) (11.4)
3500
(24.1, 241)
1000
(6.9, 69)
1500
(10.3, 103)
2000
(13.8, 138)
2500
(17.2, 172)
3000
(20.7, 207)
500
(3.4, 34)
G
H
J
K
5
(2.3)
25
(11.4)
15
(6.8)
35
(15.9)
45
(20.5)
2000
(13.8, 138)
1500
(10.3, 103)
1000
(6.9,
69)
500
(3.4, 34)
A
B
C
D
KEY
A=H-25at50Hz
B=H-25at60Hz
C=H-40at50Hz
D=H-40at60Hz
E=H-50at50Hz
❄F=H-50at60Hz
KEY
G = H-XP2 at 50 Hz
H= H-XP2 at 60 Hz
J = H-XP3 at 50 Hz
K = H-XP3 at 60 Hz
F
E
55
(25.0)
❄ Pressure flow curve for model 253725 (H-50 230V 1 phase) not shown.
Maximum pressure limited to 1700 psi (11.7 MPa, 11.7 bar)