6-10
TITRATITRA
TITRATITRA
TITRA
TIONTION
TIONTION
TION
Viewing the Titration Curve
During a titration, the titration curve can be displayed on the
Titration Graph
screen, by
pressing
. The titration ID report is also displayed inside the graph window.
Press
to stop the titration manually and return to Idle mode.
Press
to stop the titration and return to Standby mode.
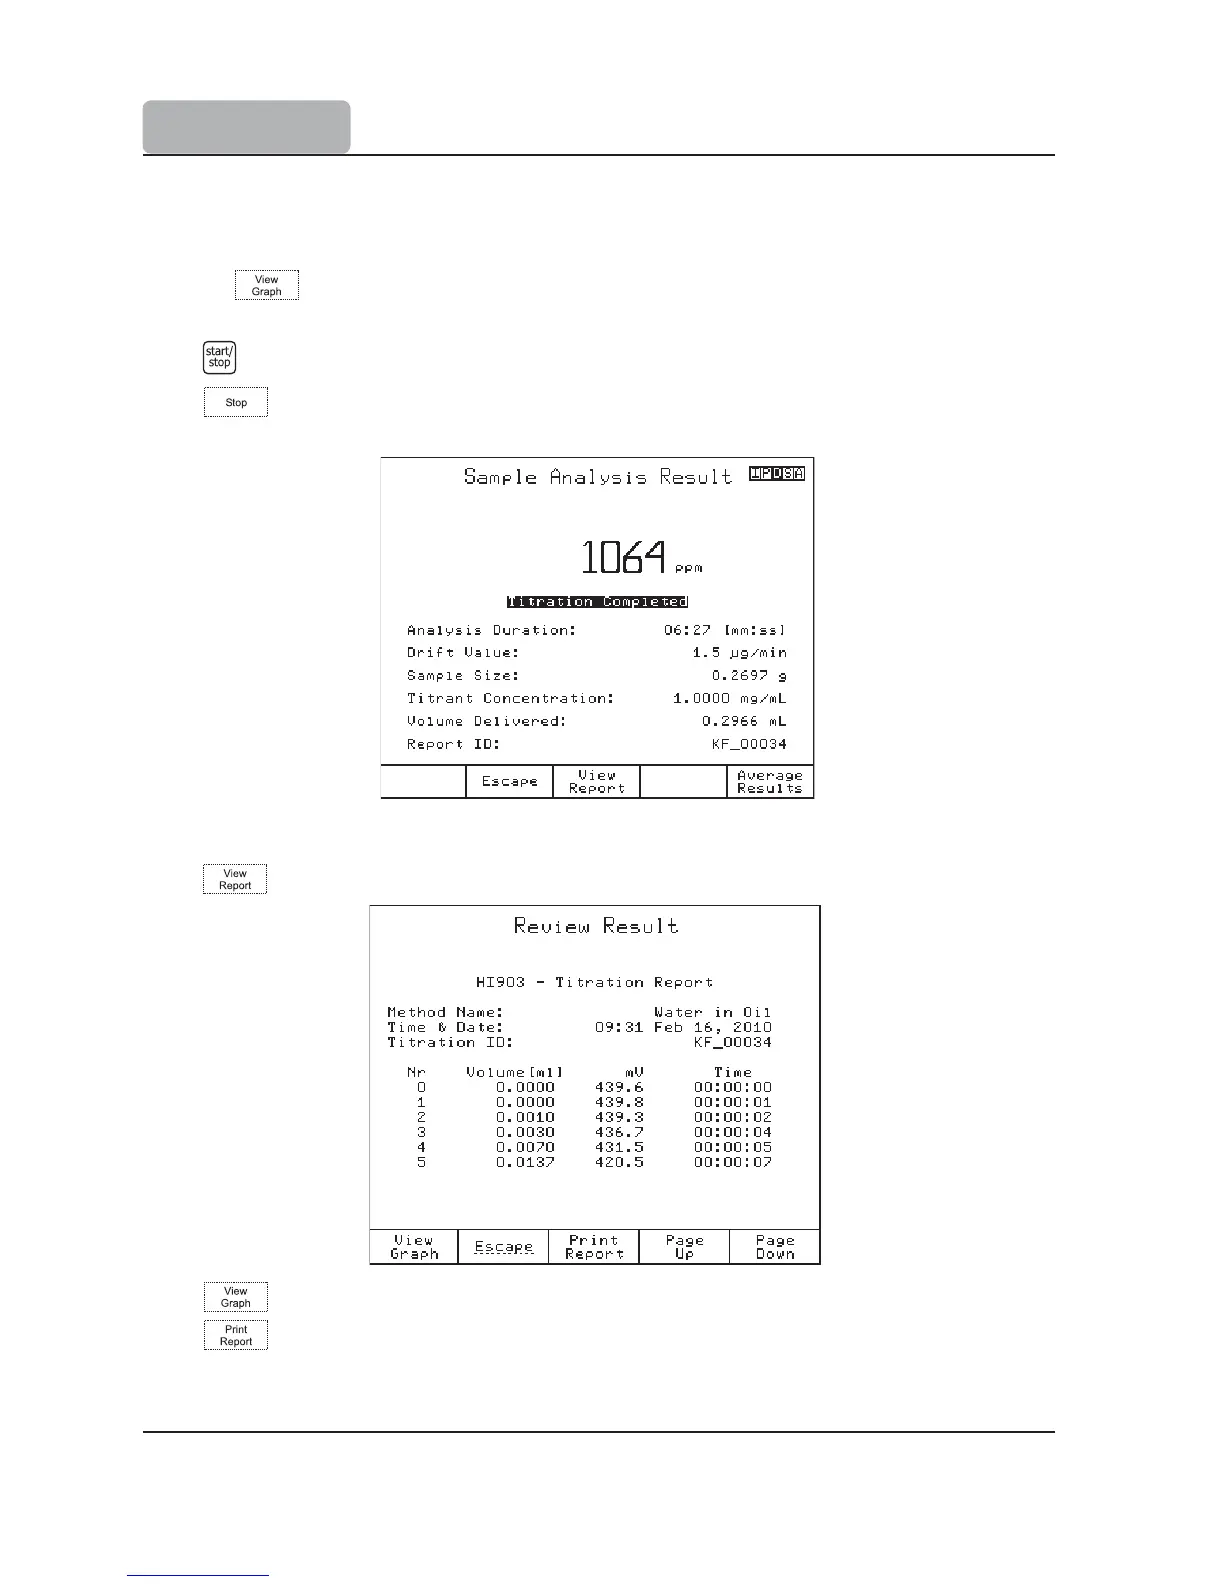
When the end point is reached the titration is finished and the following screen is displayed.
This screen displays information about the titration (duration, drift value used for compensa-
tion, sample size, titrant concentration, dispensed titrant volume, titration report ID).
Press
to see the titration report.
Press
to see the titration graph.
Press to print the report.
 Loading...