38
―――――――――――――――――――――――――――
Chapter 2 Measurement Procedure
――――――――――――――――――――――――
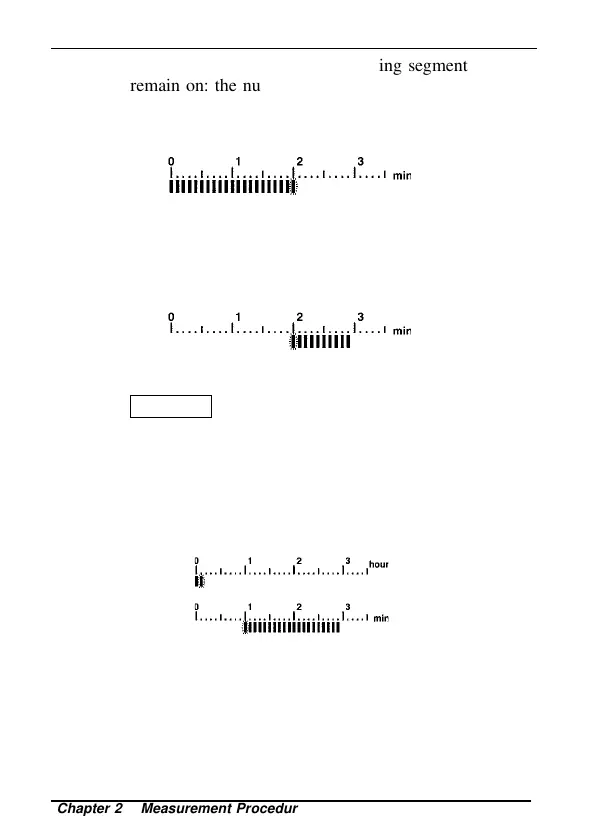
When the segments left of a flashing segment
remain on: the number of "on" segments represents
the elapsed time (0 ~ 29).
The illustration below shows when 20 minutes have
elapsed:
When the segments right of a flashing segment
remain on: the number of "off" segments (+30)
represents the elapsed time (30 ~ 59).
The illustration below shows when 50 minutes have
elapsed:
When digital display switches the average value
(AVE) to a instantaneous value when you press the
MAX/MIN
key, the right corner of the bar graph
indicates hours. In this mode, each segment of the
bar graph corresponds to one hour. The way to read
the bar graph here is similar to reading it in
minutes. When all bar graph segments remain on,
the elapsed time is 29 hours.
The illustration below shows when one hour, 40
minutes have elapsed.