Discovery QDR Series Technical Manual
1-4
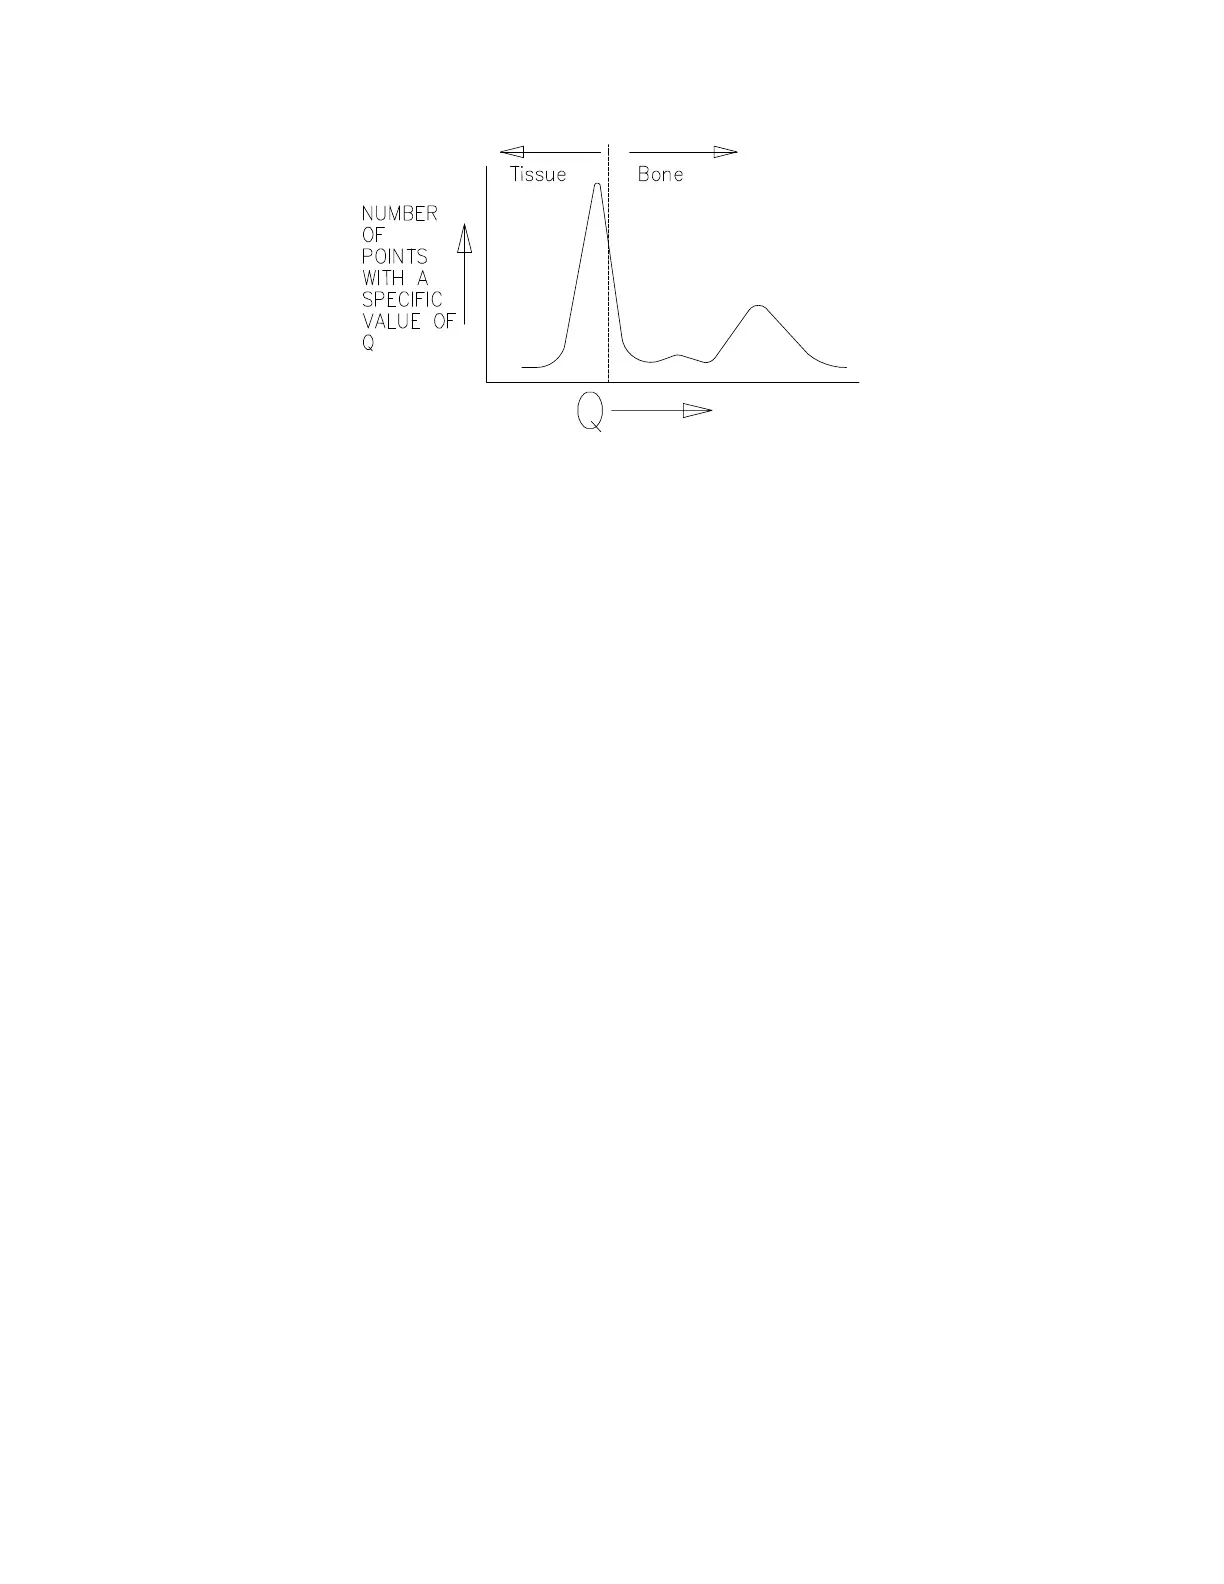
Figure 1-3. Q Scan Plot
5. Use the "non-bone" points to calculate a baseline value for each scan line. Using
these points, form a new histogram and repeat steps 4 and 5 until the results con
-
verge.
6. Smooth the segment boundaries to eliminate isolated noise-generated "bone"
points.
7. Display the "bone" and "non-bone" points for operator approval.
8. Determine the constant of proportionality (d0) that relates the Q values to actual
BMC (grams). This constant is determined by measuring how much Q shifts
when bone-equivalent material is interposed by the filter drum.
9. Calculate the total bone mineral values by adding up the Q values for all "bone"
points in each region of interest (e.g., each vertebra), and multiplying by d0.
10. Determine the bone areas by counting the number of "bone" points in each region
of interest.
11. Calculate bone mineral density as:
BMD = BMC / area
12. Display the calculated results and print the report.
1.2 Functional Overview
This section provides block diagrams of the Discovery system along with a brief
functional overview of each diagram and block. A detailed functional description along
with interconnection diagrams and interconnection descriptions is provided in Section 2 of
this manual.