Daily Operation
MAN0996_Iss 1_02/16 Touchpoint Plus
Pt. No. 3011M5044_EN 37 User Guide
4.13
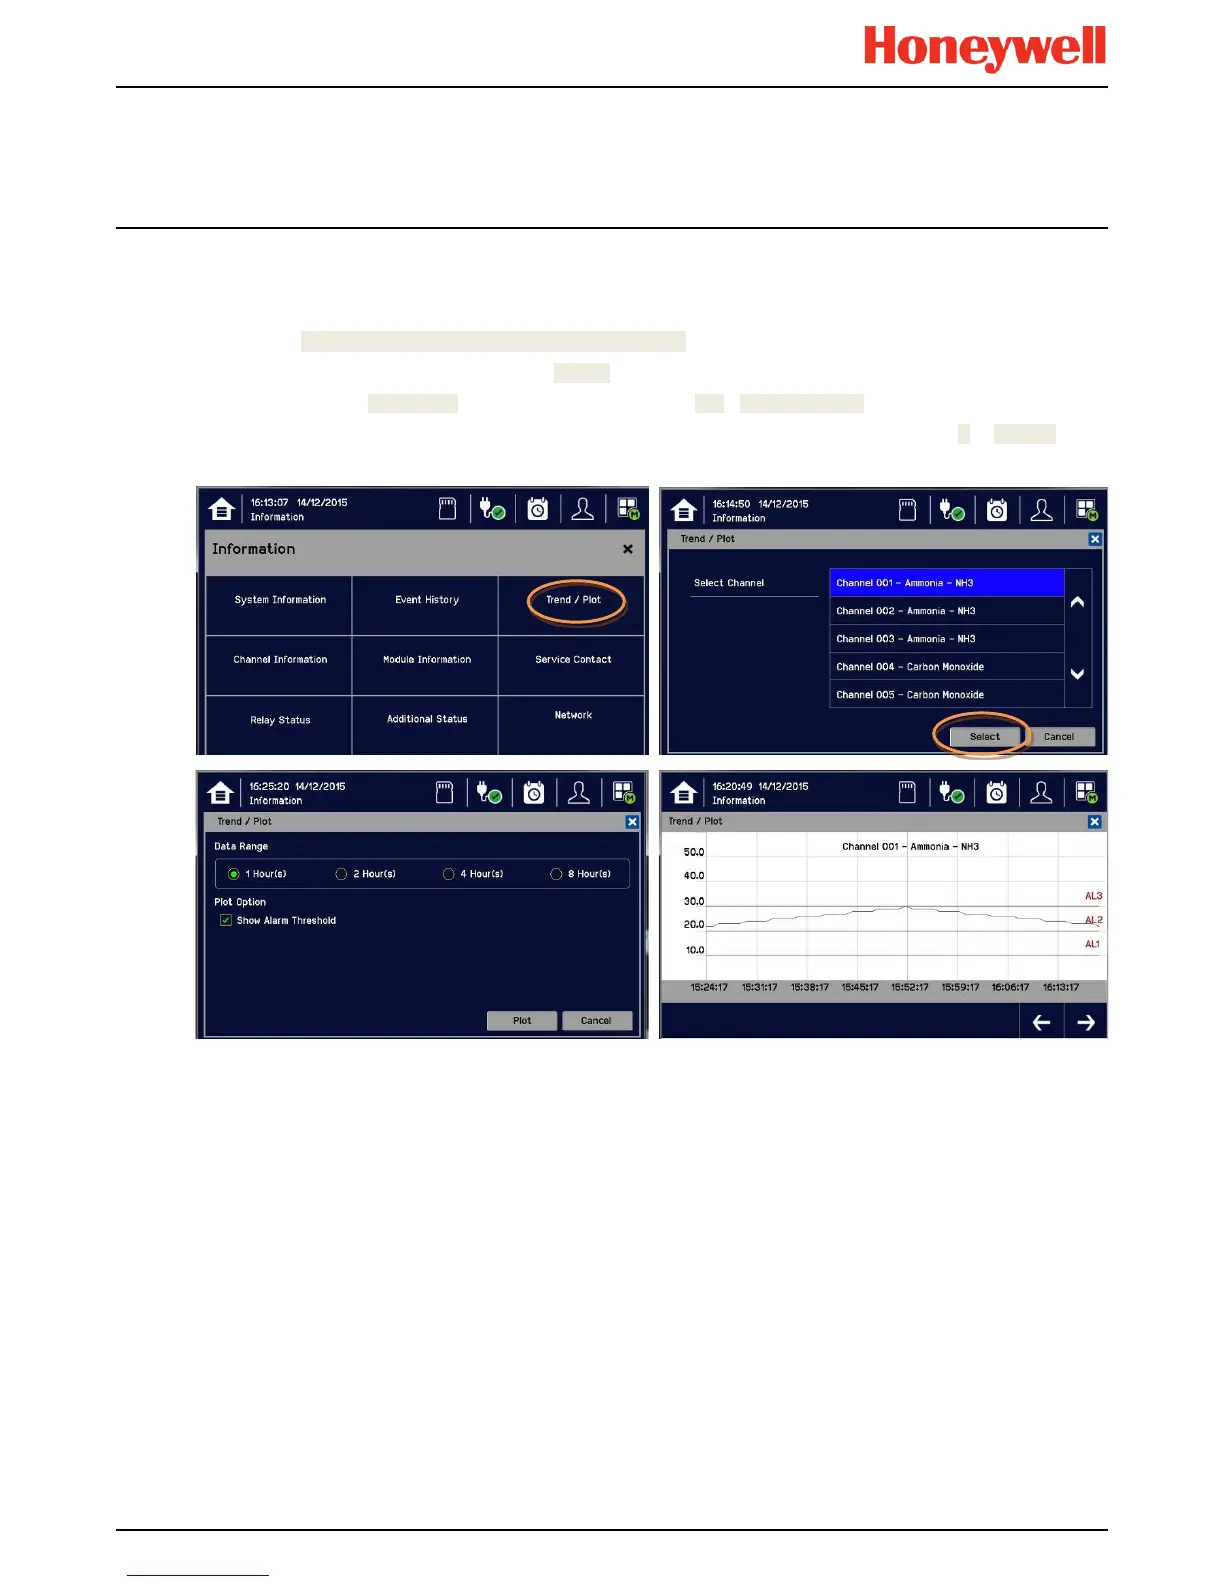
Viewing the Trend
Graph
The Trend graph is drawn using one minute average readings so it is not suited to viewing short-term signal fluctuations.
To view the graph:
1) Touch the Menu Icon>Information>Trend / Plot.
2) Touch the required channel, and then touch [Select].
3) Select the required Data Range (1/2/4/8 hours) and then touch Plot. (Alarm Threshold is shown by default.)
4) The trend graph will be displayed. Use the arrows to move backwards or forwards in time; use the X or [Cancel] to
exit.
Note: The Touchpoint Plus Trend / Plot will retain up to the latest 8 hours of data but will be cleared after a power reset.
Note: Touchpoint Plus does not adjust automatically for daylight savings time but it will retain a backup of the earlier data
if the system clock is backdated (e.g. when ending daylight savings time).