TDR Fundamentals
Instrument Configuration
9-23
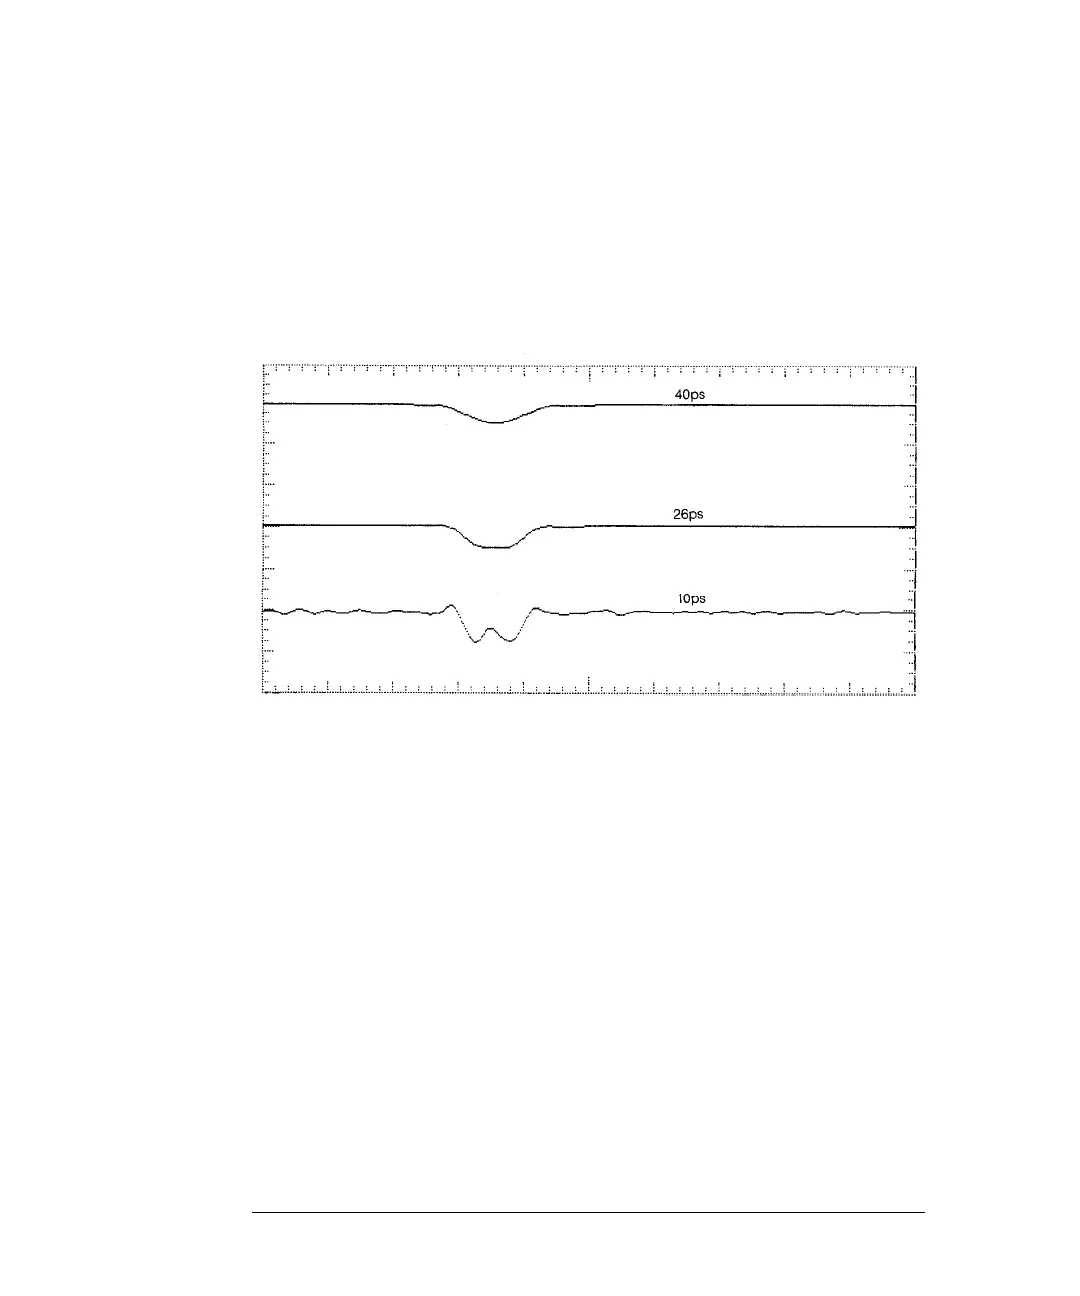
The results of a TDR measurement, using normalization to decrease the system
risetime, on this airline at three different risetimes (40, 26, and 10 ps) is shown
in Figure 9-21. At 40 ps it is not possible to distinguish each discontinuity. At
26 ps the separate discontinuities begin to show. Finally, at 10 ps risetime both
discontinuities are clearly discernible.
Figure 9-21
Two Discontinuities 2 mm Apart can be Distinguished with a System Risetime of 10 ps
Small L's and C's
Figure 9-22 is an example of risetime effects for a series L discontinuity in a 50
Ω line. If the combined step generator and sampler risetime, t
r
system
, is much
less than the risetime of the low-pass filter, t
r lpf
, created by the discontinuity
(where t
r
lpf
~ 2.2 × T where T = L ÷ 100 Ω), the result approaches the ideal as
shown in Figure 9-22 Plot A. If t
r system
~ t
r lpf
, the result is as shown in Figure
C-26 Plot C. If t
r system
> t
r lpf
, the result is as shown in Figure 9-22 Plot D.
Plot A: t
r lpf
= 100 × t
r system
= approaches ideal
Plot B: t
r lpf
= 10 × t
r system
Plot C: t
r lpf
= t
r system
Plot D: t
r lpf
= 1/10 × t
r system
t
r system
= Combined risetime of the step generator and sampler.
t
r lpf
= Risetime of the low pass filter created by the discontinuity.