Improving Time Domain Network Measurements
Removing Measurement Errors
10-8
Figure 10-3
Test system with the device at the end of an imperfect test fixture
This example uses two identical printed circuit boards (PCBs) to model this
measurement. The PCBs have a 50 Ω trace on them with two discontinuities.
The first PCB represents the test fixture, and the second PCB represents the
DUT. The goal is to accurately measure the reflections caused by the DUT
(second PCB). Figure 10-4 is the unnormalized response of the system.
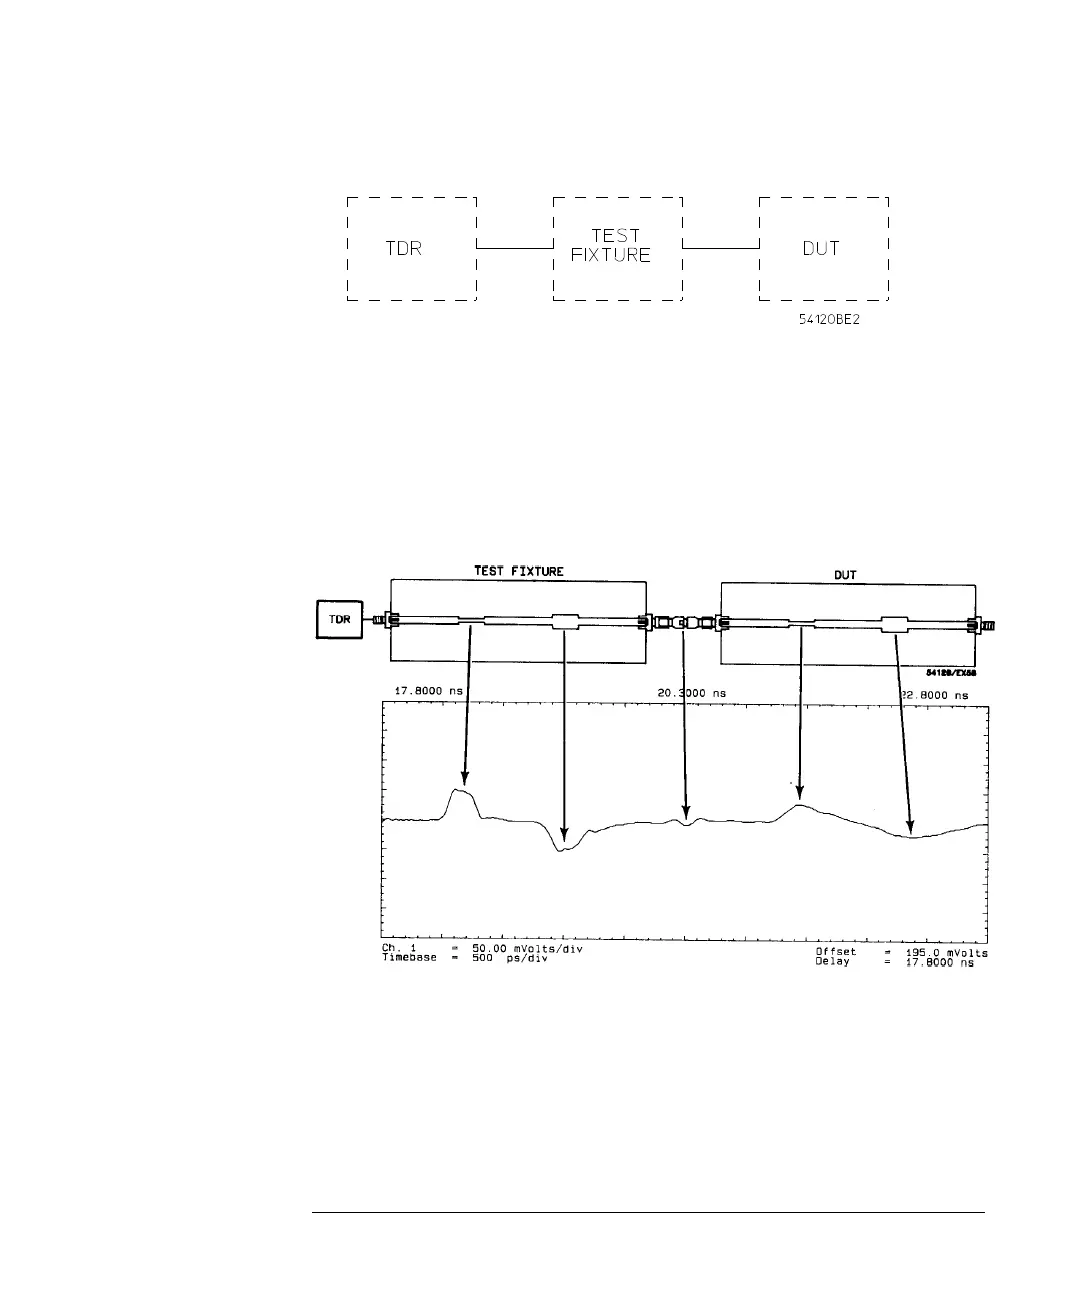
Figure 10-4
In an unnormalized measurement, the reflections from the DUT are masked by the imperfect test
fixture
The TDR response shows the reflections of the second PCB to be different from
the first PCB. TDR accurately measures the first discontinuity. But TDR
measures each succeeding discontinuity with less accuracy, as the transmitted
step degrades and multiple reflections occur. Thus the two identical boards
show different responses.
 Loading...