PQA400 - PQA823 - PQA824
EN - 104
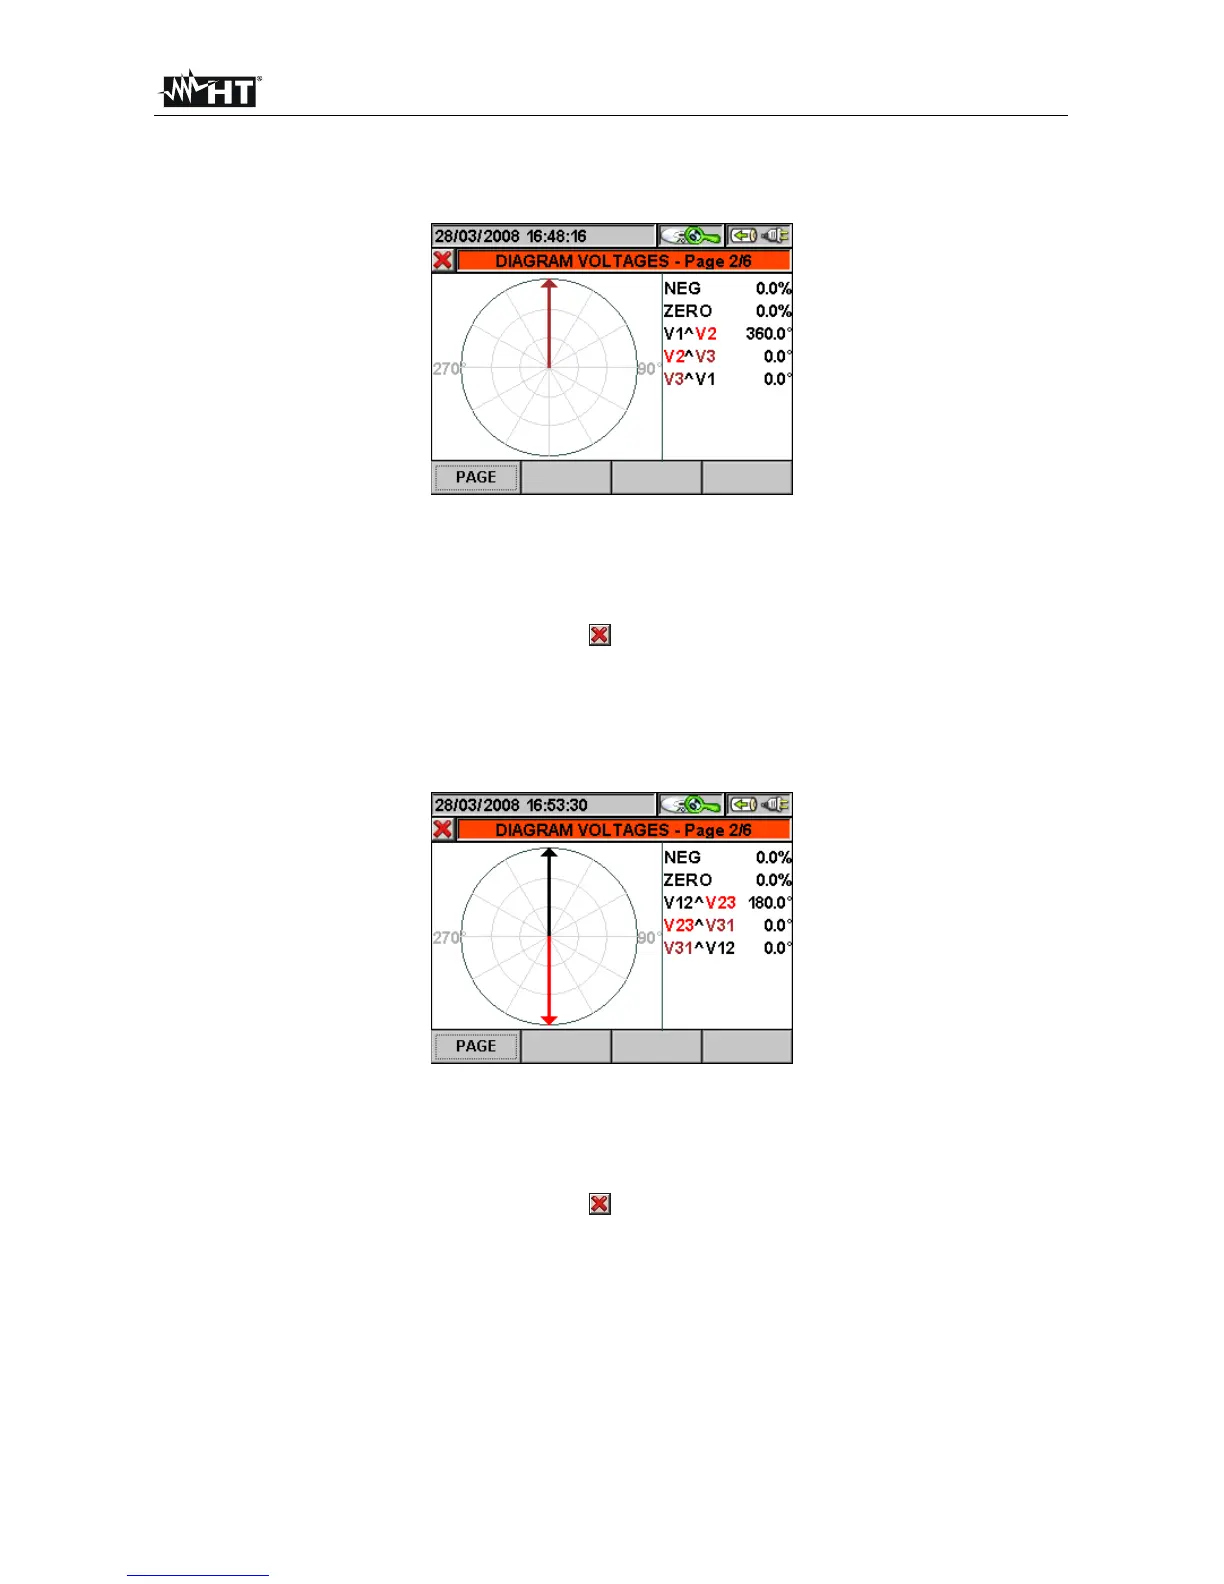
This screen (Fig. 170) displays, with graphic and numeric indications, the phase delays,
expressed in degrees [°], between voltage V1 and V2, V2 and V3, V3 and V1. Voltage
unbalance values are also displayed.
Fig. 170: Voltage vector diagram in three-phase 4-wire system
The following keys are active on this page:
The F1 key (or the PAG item on the display) advances to the following page of
saved values relative to the current vector diagram.
The ESC key (or the smart icon on the display) to exit the function and go back
to the “Recording analysis” page (Fig. 143).
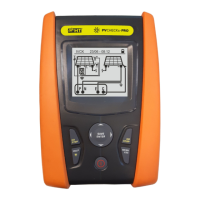
This screen (Fig. 171) displays, with graphic and numeric indications, the phase delays,
expressed in degrees [°], between voltage V12 and V23, V23 and V31, V31 and V12.
Voltage unbalance values are also displayed.
Fig. 171: Voltage vector diagram in three-phase 3-wire system or Aron system
The following keys are active on this page:
The F1 key (or the PAG item on the display) advances to the following page of
saved values relative to the current vector diagram.
The ESC key (or the smart icon
on the display) to exit the function and go back
to the “Recording analysis” page (Fig. 143).