PQA400 - PQA823 - PQA824
EN - 74
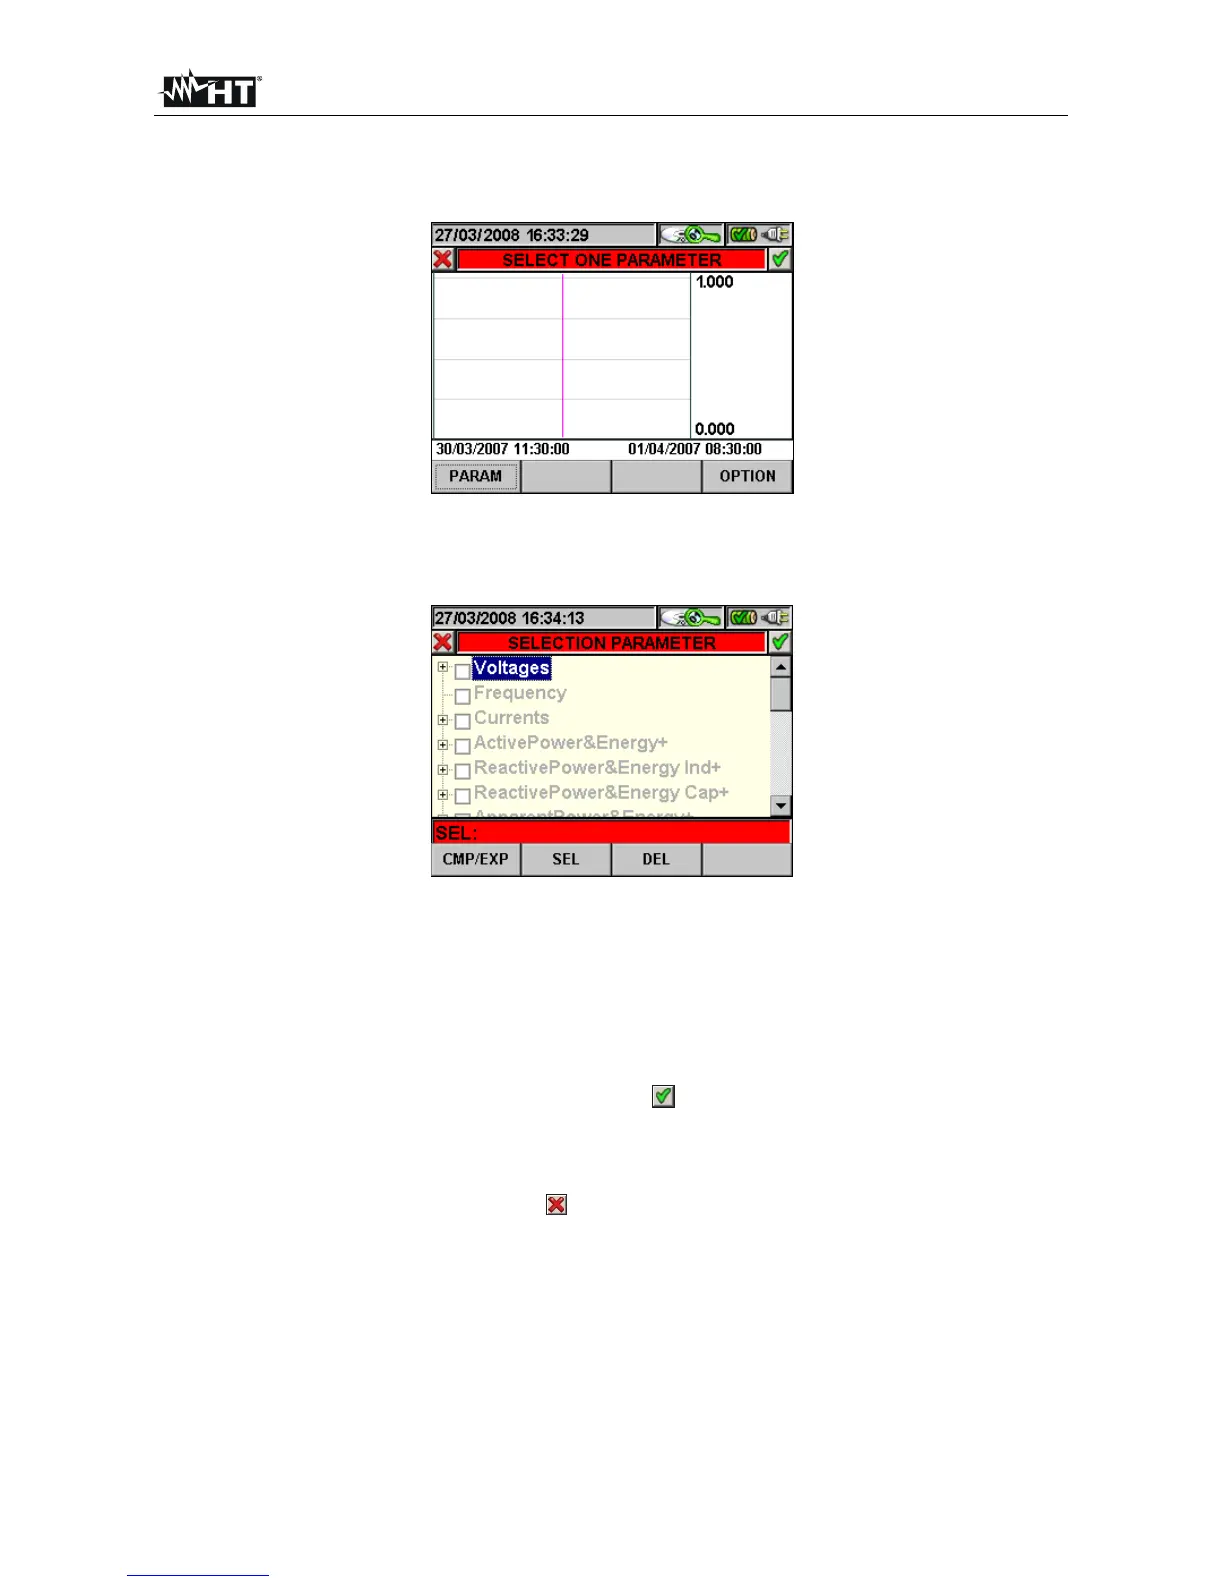
5.5.1.2. Recording graph
By selecting the recording graph option, the following page is accessed, which enables the
user to display the recording trend (ONLY ONE parameter at a time).
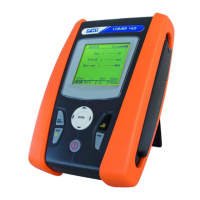
Fig. 127: Selecting a parameter
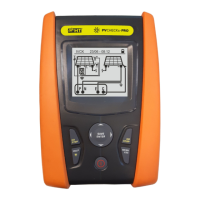
1. Press the F1 key (or the PARAM item on the display) to access the page containing
the recorded quantities available for the analysis (Fig. 128).
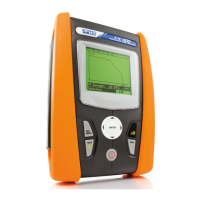
Fig. 128: Parameter selection
The following keys are active on this page:
The up and down arrow keys move the cursor along the quantity tree.
The F1 key (or the CMP/EXP item on the dislay) compresses and expands the
tree of the quantity highlighted by the cursor.
The F2 key (or the SEL item on the dislay) selects or deselects the parameter
highlighted by the cursor.
The ENTER key (or the smart icon on the display) confirms the selection
previously made and displays the graph of the selected parameter (Fig. 129).
The CANC key deselects the parameter previously selected, independently from
the position of the cursor.
The ESC key (or smart icon ) to exit the function and go back to the “Selecting
a parameter” page (Fig. 127).