PQA400 - PQA823 - PQA824
EN - 84
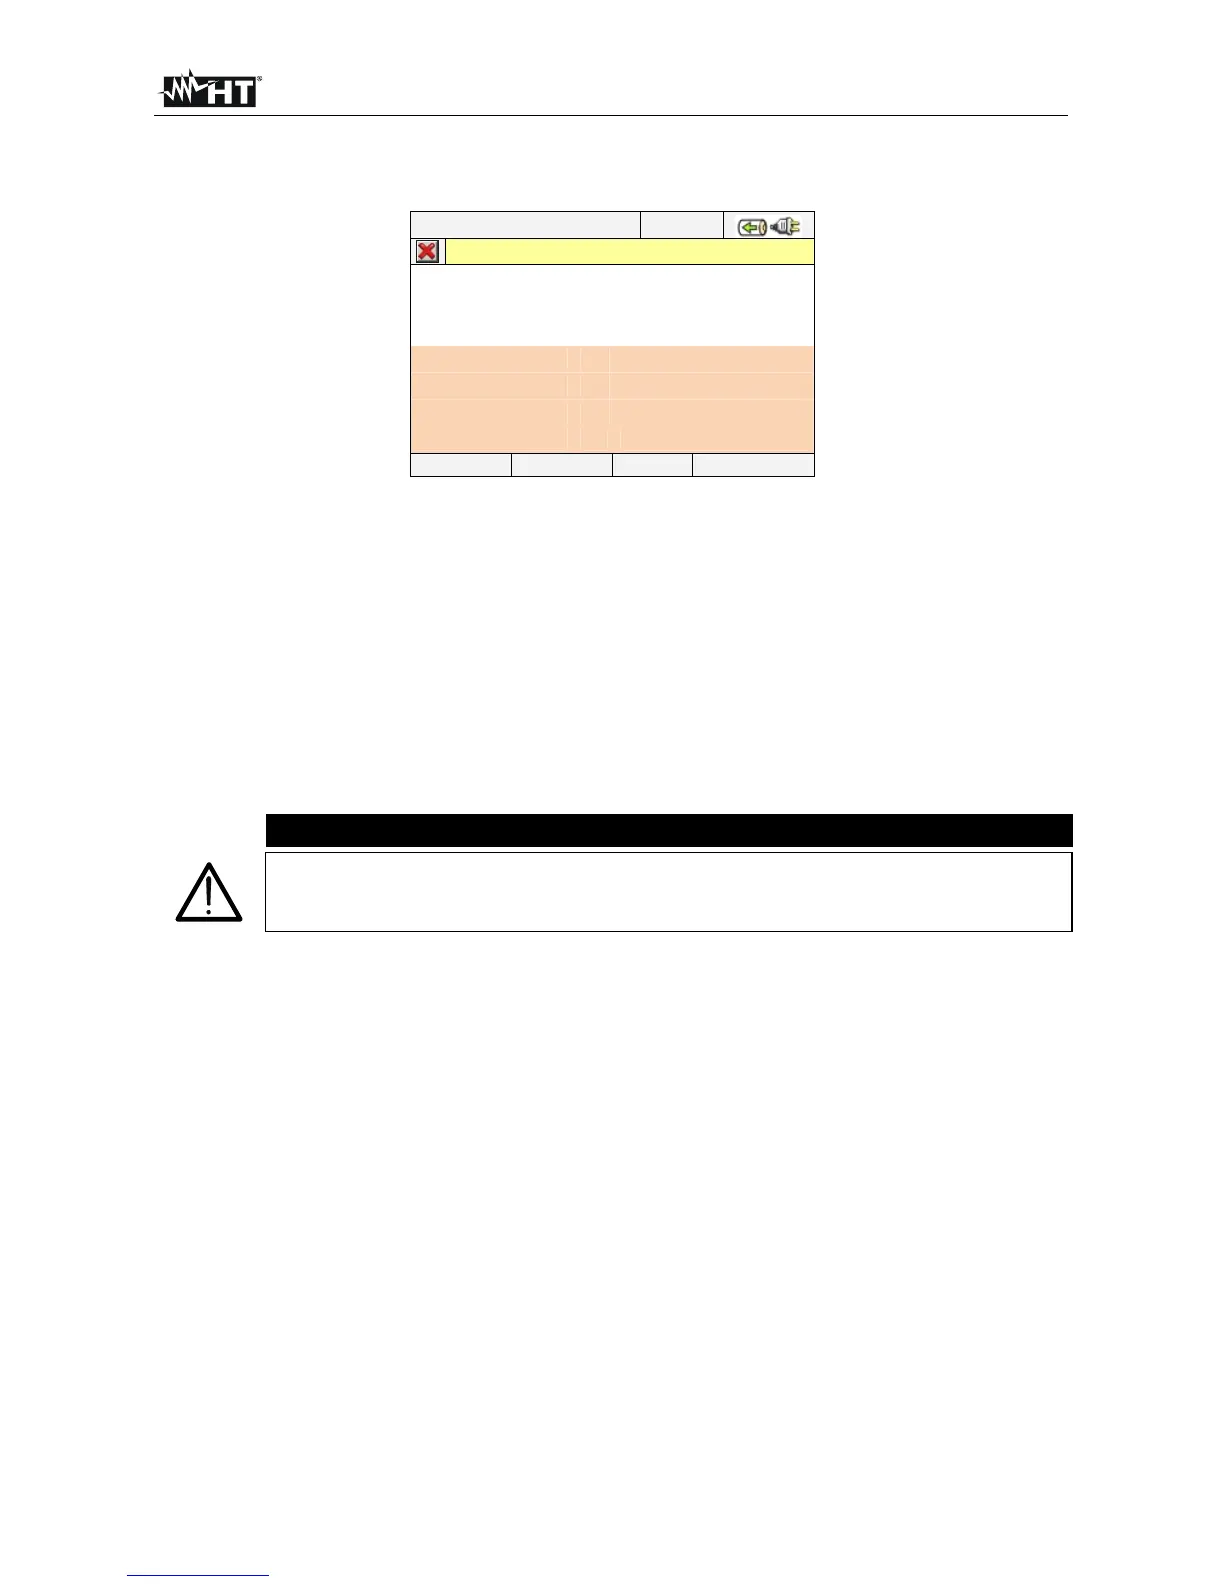
5.5.1.8. Analysis of producted energy
This page shows the Energy and Peak power values producted while recording
25/01/2013 – 16:55:10
TOT. ENERGY PRODUCTION – Pag x/y
Eact = 15 Wh
Ppeak = 1.31 kW
Date Ppeak : 21/01/13 16:45:00
Start rec. : 21/01/13 16:45:00
Stop rec. : 21/01/13 18:00:00
Rec. Time : 00d 1h 15m
Int. Per. : 15m
PAGE SCOPE HARM VECTORS
Fig. 142: Screen of total producted energy
Description of the displayed values:
Eact: Total active power produced while Recording.
Ppeak: Max. active power peak (measured on 16 periods of mains frequency)
produced while recording
Date Ppeak: Date and time in which the power peak occurred
Start rec.: Starting date of the recording
Stop rec.: Stopping date of the recording
Rec. Time Recording time expressed in days (d), hours (h) and minutes (m)
Int. Per.: Set integration period value
CAUTION
The Total Produced Energy page is shown only if general parameter Total
“Active Power & Energy” has been recorded (see § 5.4.6.1) and if the
recording parameter “Co-generation” has been enabled (see § ).