PQA400 - PQA823 - PQA824
EN - 75
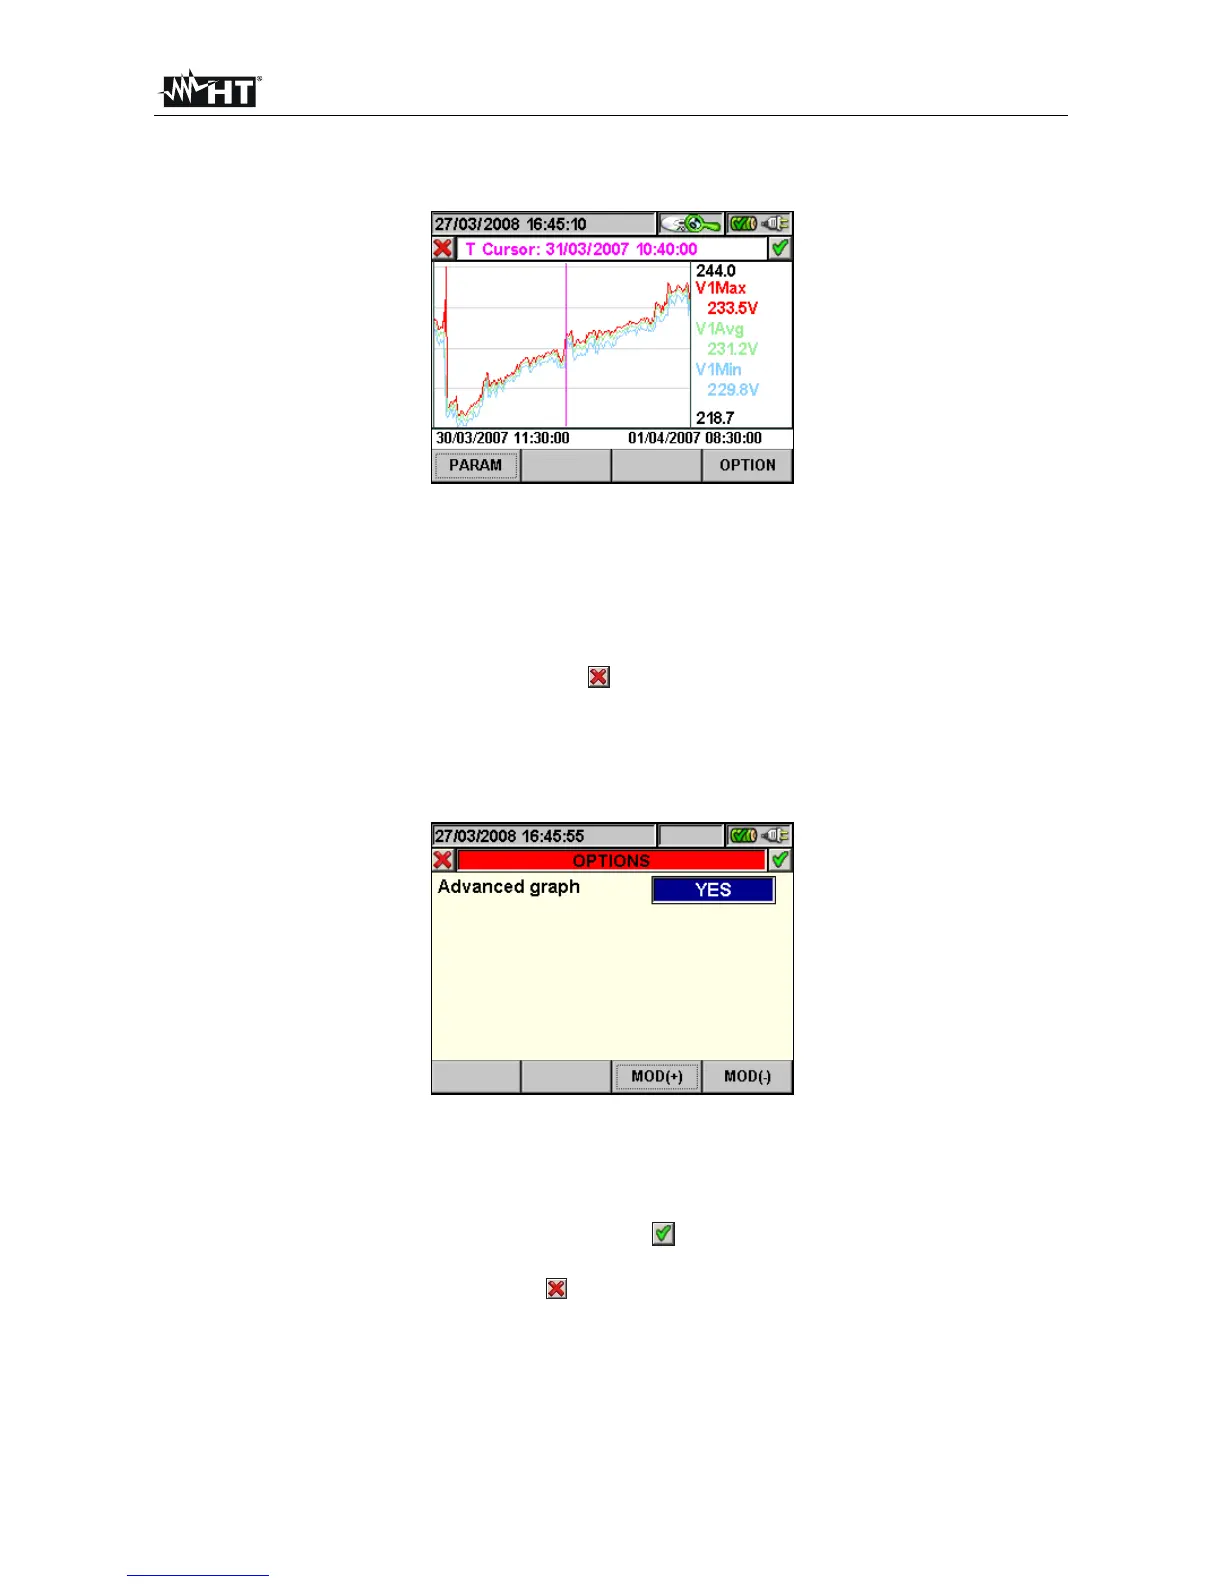
This page shows the graph, the cursor position (cursor T) and the maximum, minimum and
average RMS values of the parameter selected by the cursor.
Fig. 129: Recording graph
The following keys are active on this page:
F1 key (or PARAM item on the display) to access the page of the selectable
parameters (Fig. 128).
F4 key (or OPTIONS item on the display) to access the page for the activation of
the “Advanced graph” (Fig. 130).
The ESC key (or smart icon ) to exit the function and go back to the
“Recording analysis” page (Fig. 125).
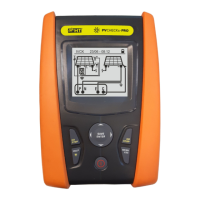
2. Press the F4 key (or the OPTIONS item on the display) to access the page for the
activation of the Advanced graph (Fig. 130).
Fig. 130: Options (Advanced graph)
The following keys are active on this page:
The F3 and F4 keys (or the MOD(+) and MOD(-) items on the display) enable
the user to choose YES or NO for the advanced graph.
The ENTER key (or the smart icon
on the display) confirms the selection
previously made.
The ESC key (or smart icon
) to exit the function and go back to the “Selecting
a parameter” page (Fig. 127).
Example of advanced graph.
Let us take a recording of 2000 pixels into consideration. The PQA has a display with a
useful resolution of about 200 pixels; therefore, it is not able to distinctly display all the
pixels in our recording. How does it operate then? The first pixel in the graphs of the