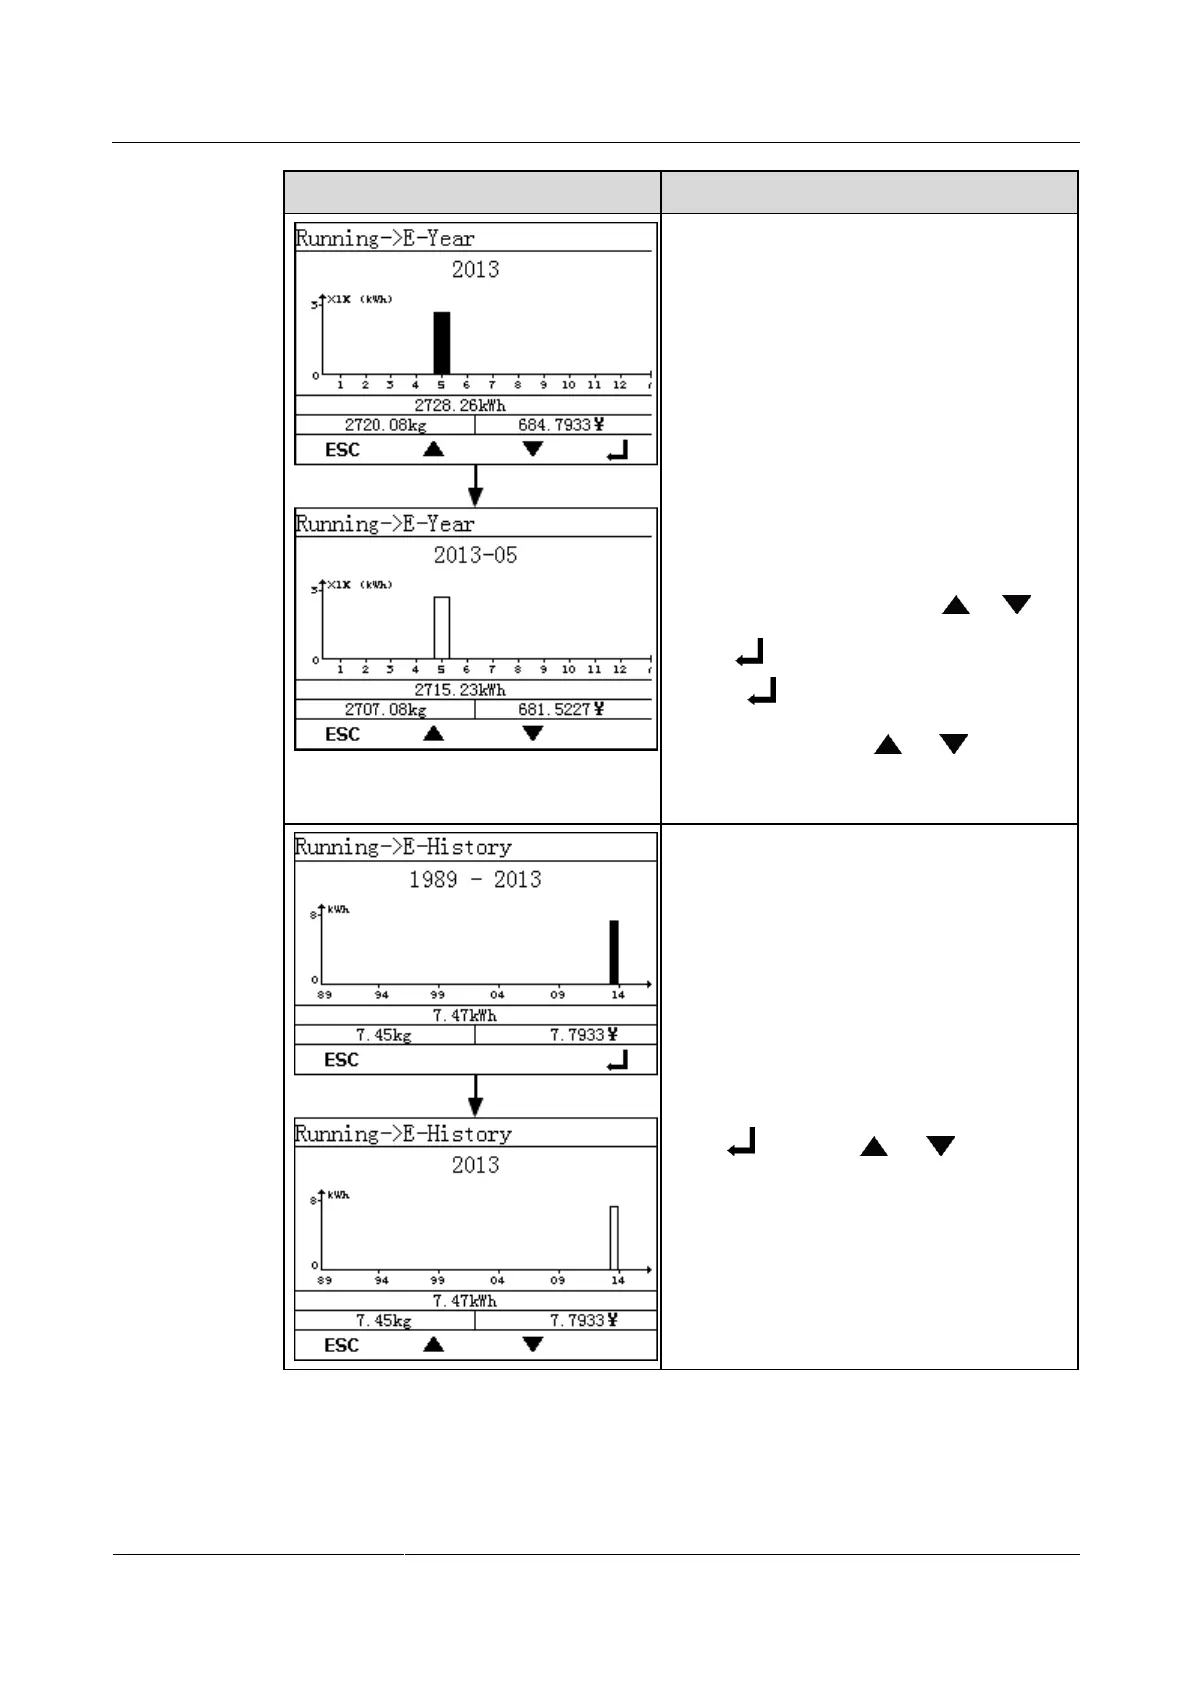
a. On the E-Year screen, view the total energy
yield and monthly energy yield in the current
year. The displayed information includes the
yearly energy yield histogram, date, total
energy yield of the current year, CO
2
emission
reduction, and revenue from the energy yield.
NOTE
In the yearly energy yield histogram, the year is
represented by the horizontal axis in one-month
intervals. The energy yield is represented by the
vertical axis. Each bar represents the total energy
yield for that month.
NOTICE
To view the energy yield in the past 25 years
(including the current year), press or . To
view the monthly energy yield in a specific year,
press .
b. Press to view the energy yield in a
specific month of the current year. To switch
between months, press or .
NOTE
The selected block is displayed in white.
7. On the E-History screen, view the
historical energy yield. The LCD displays the
yearly energy yield histogram, time periods,
total energy yield of the selected year, CO
2
emission reduction, and revenue from the
energy yield. Data of the past 25 years (current
year included) are available.
NOTE
In the yearly energy yield histogram, the year is
represented on the horizontal axis. The energy yield
is represented by the vertical axis. Each bar
represents the total energy yield for that year.
Press , then press or to view the
energy yield of the selected year.