208
AutoChart Live
C AC L M D S
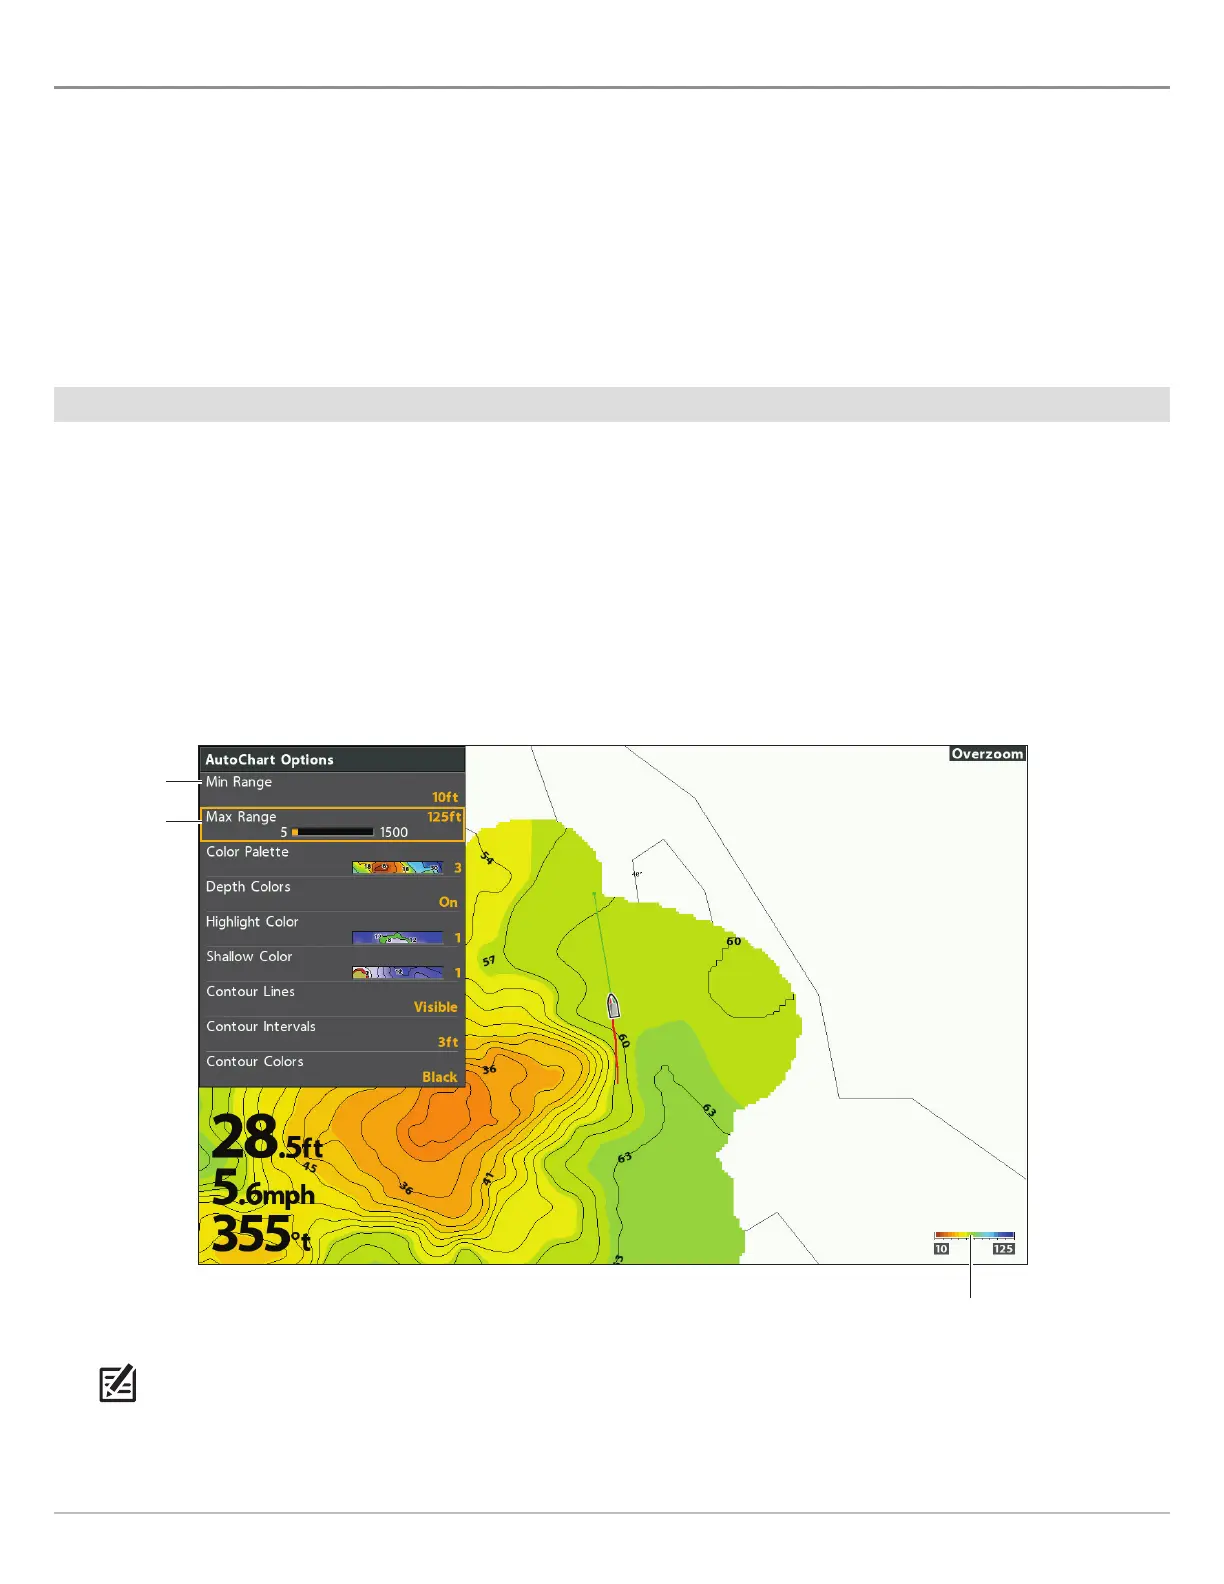
Use the AutoChart Options menu to adjust the depth range, contour interval, and map position. You can also change the color
palette and shading.
Open the AutoChart Options Menu
You will use the AutoChart Options menu for all display settings.
1. Chart X-Press Menu: With a Chart View displayed on-screen, press the MENU key once.
2. Select AutoChart. Press the RIGHT Cursor key.
3. Select AutoChart Options. Press the RIGHT Cursor key.
Adjust the Depth Range
You can adjust the range of data shown on the chart by changing the minimum range and maximum range on the display. The
range you select affects how the depth colors are displayed. For related color or shading options, see Change the Display Colors.
1. From the AutoChart Options menu, select Min Range.
2. Press the RIGHT or LEFT Cursor keys to adjust the setting.
3. Select Max Range.
4. Press the RIGHT or LEFT Cursor keys to adjust the setting.
depth scale
(AutoChart Color Bar)
low range
high range
Adjusting the AutoChart Live Map Depth Range
NOTE: Use the AutoChart Color Bar icon see the selected palette and, from left to right, the AutoChart depth range (low to high),
Bottom Hardness range (soft to hard), or Vegetation range (soft to hard).
 Loading...