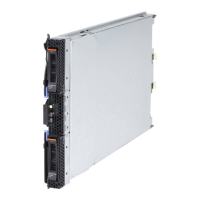
Network Monitoring
This section is divided into three main areas: Statistics, Address Table, and
Applications. In addition, this section contains secondary windows.
Statistics
This section contains descriptions and illustrations of the following windows:
v Port Utilization
v Port Error Packets
v Port Packet Analysis
Port Utilization
The switch module can display the utilization percentage of a specified port in the
following window.
The information on this window is described as follows:
Tx/sec
The rate at which the given port is transmitting packets, in packets per
second.
Rx/sec
The rate at which the given port is receiving packets, in packets per
second.
% Utilization
The percentage utilization of the available bandwidth of the given port.
Port Error Packets
The Web Manager enables various packet statistics to be viewed as either a line
graph or a table.
The Port Error Packet window contains the following information:
62 IBM BladeCenter 4-Port Gb Ethernet Switch Module: Installation and User’s Guide