188 IBM NeXtScale System Planning and Implementation Guide
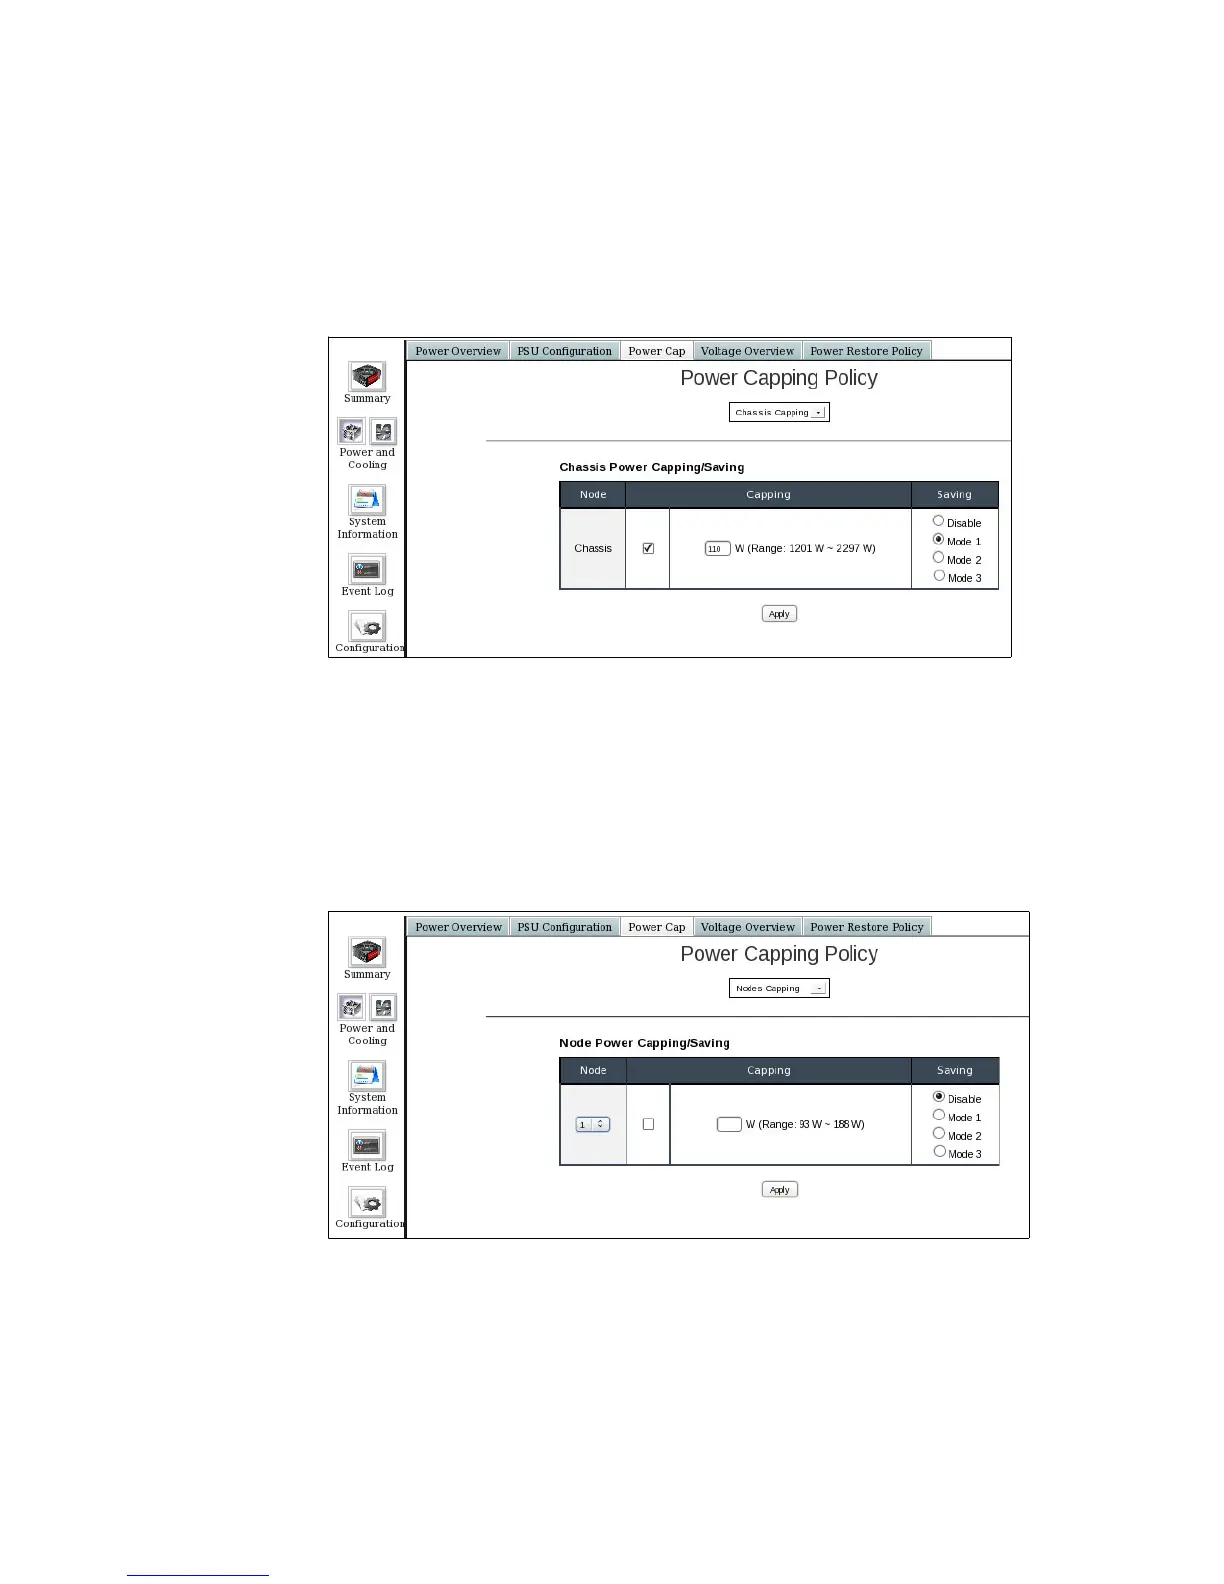
Figure 7-20 shows power capping windows at chassis level. The range that is
suggested is based on the aggregation of the minimum and maximum power
consumption for the nodes that are installed at the chassis.
Figure 7-20 Power capping at chassis level
Power capping at node level is selected via the drop-down menu. The specific
node is selected in the drop-down menu that appears inside the table. Here, the
suggested range is based on the minimum and maximum consumption of the
node. Again, any value that is outside of the range is allowed, but it might not be
reached. Figure 7-21 shows power capping windows at node level. The range
that is suggested is based on the minimum and maximum power consumption for
the nodes that are selected.
Figure 7-21 Power capping at node level