79
Copyright © 2004-2012 by InfiNet Wireless
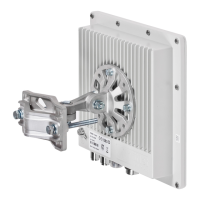
By default the system displays daily data logs. All charts support simultaneous
zooming to improve usability: once the user zooms into a certain region on any
of the charts, all other charts are re-scaled automatically to display the data
collected during the same period of time.
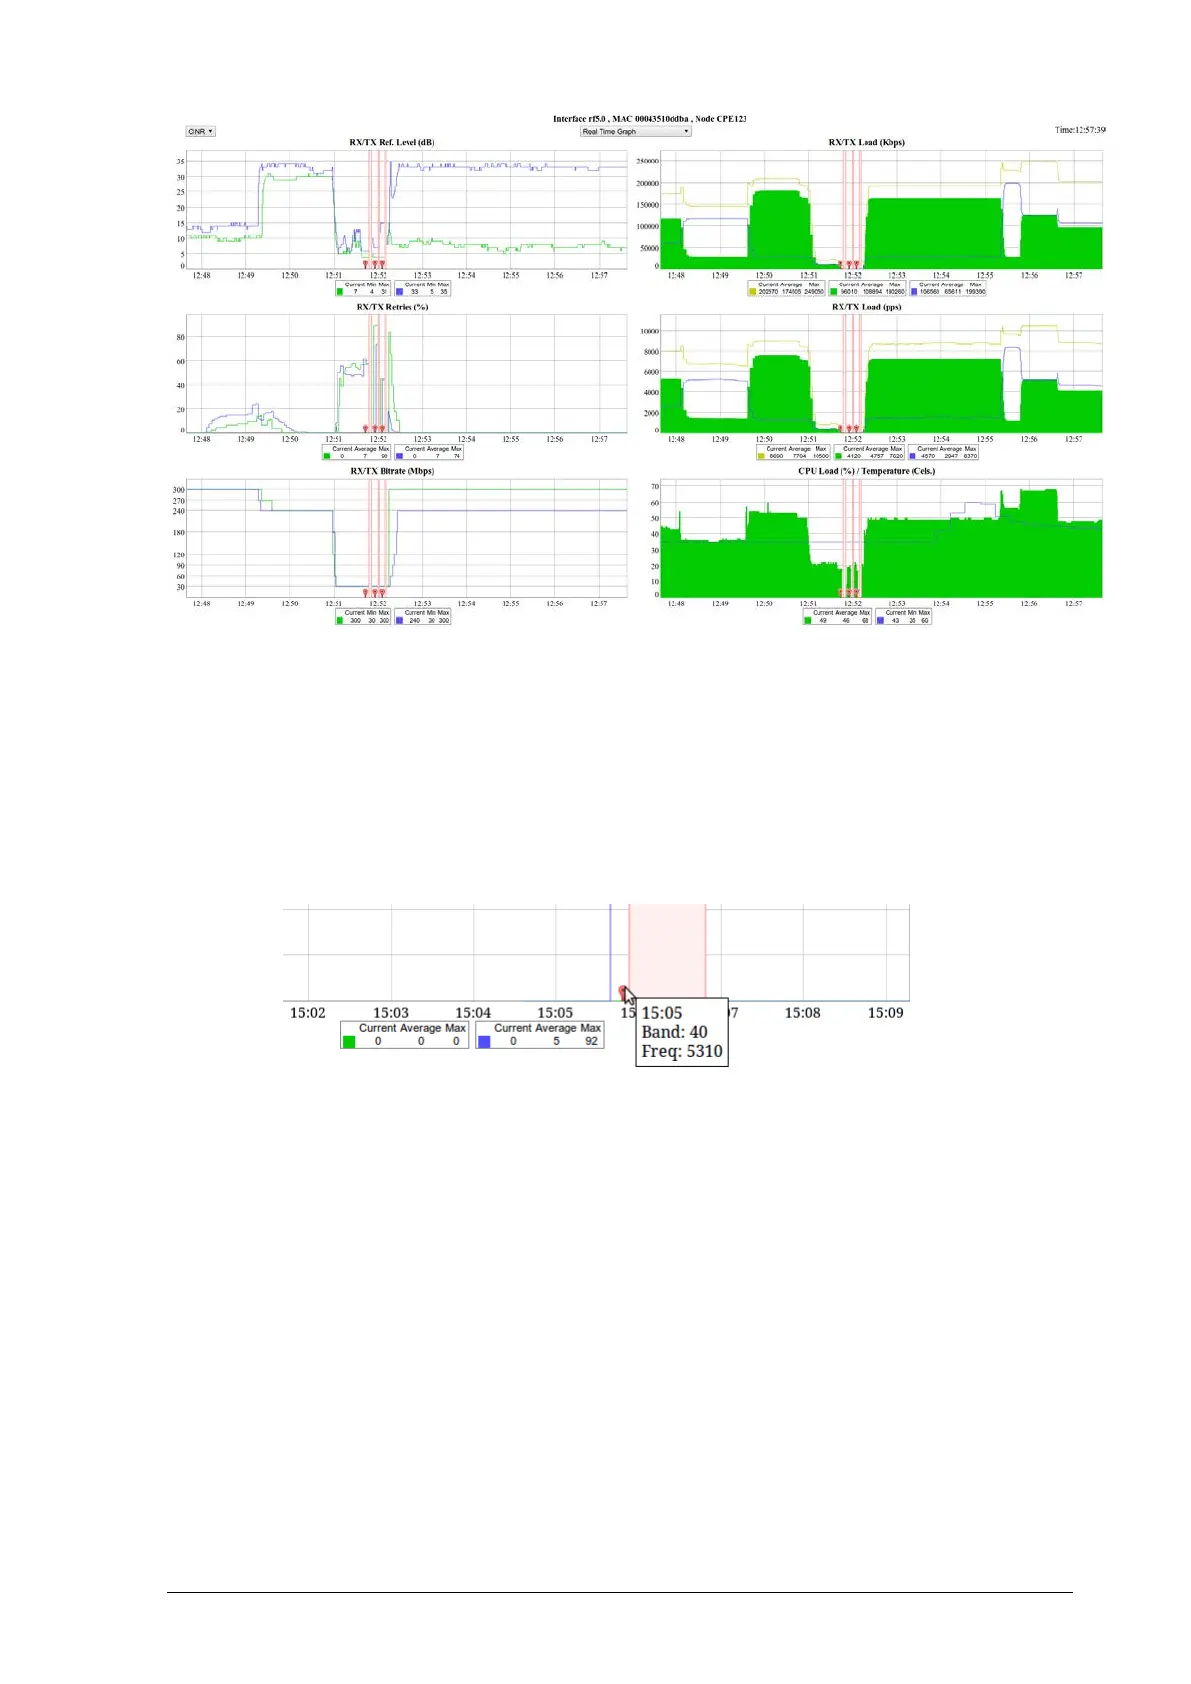
Critical events like link outages or frequency swaps are marked by small red
balloons on the bottom of each graph. Hover over each balloon for details.
Working with the charts:
• Select chart region to zoom in.
• Hold Shift button and drag the graphs to pan.
• Double-click any chart to reset zoom.
The parameters set includes:
RX/TX Ref. Level (dB)