80
Copyright © 2004-2012 by InfiNet Wireless
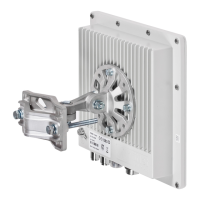
This chart displays measured RX (green) and TX (blue) signal levels. Red regions
represent link outages. Default graph uses CINR measurement method, however
RSSI method can be selected from the drop-down menu.
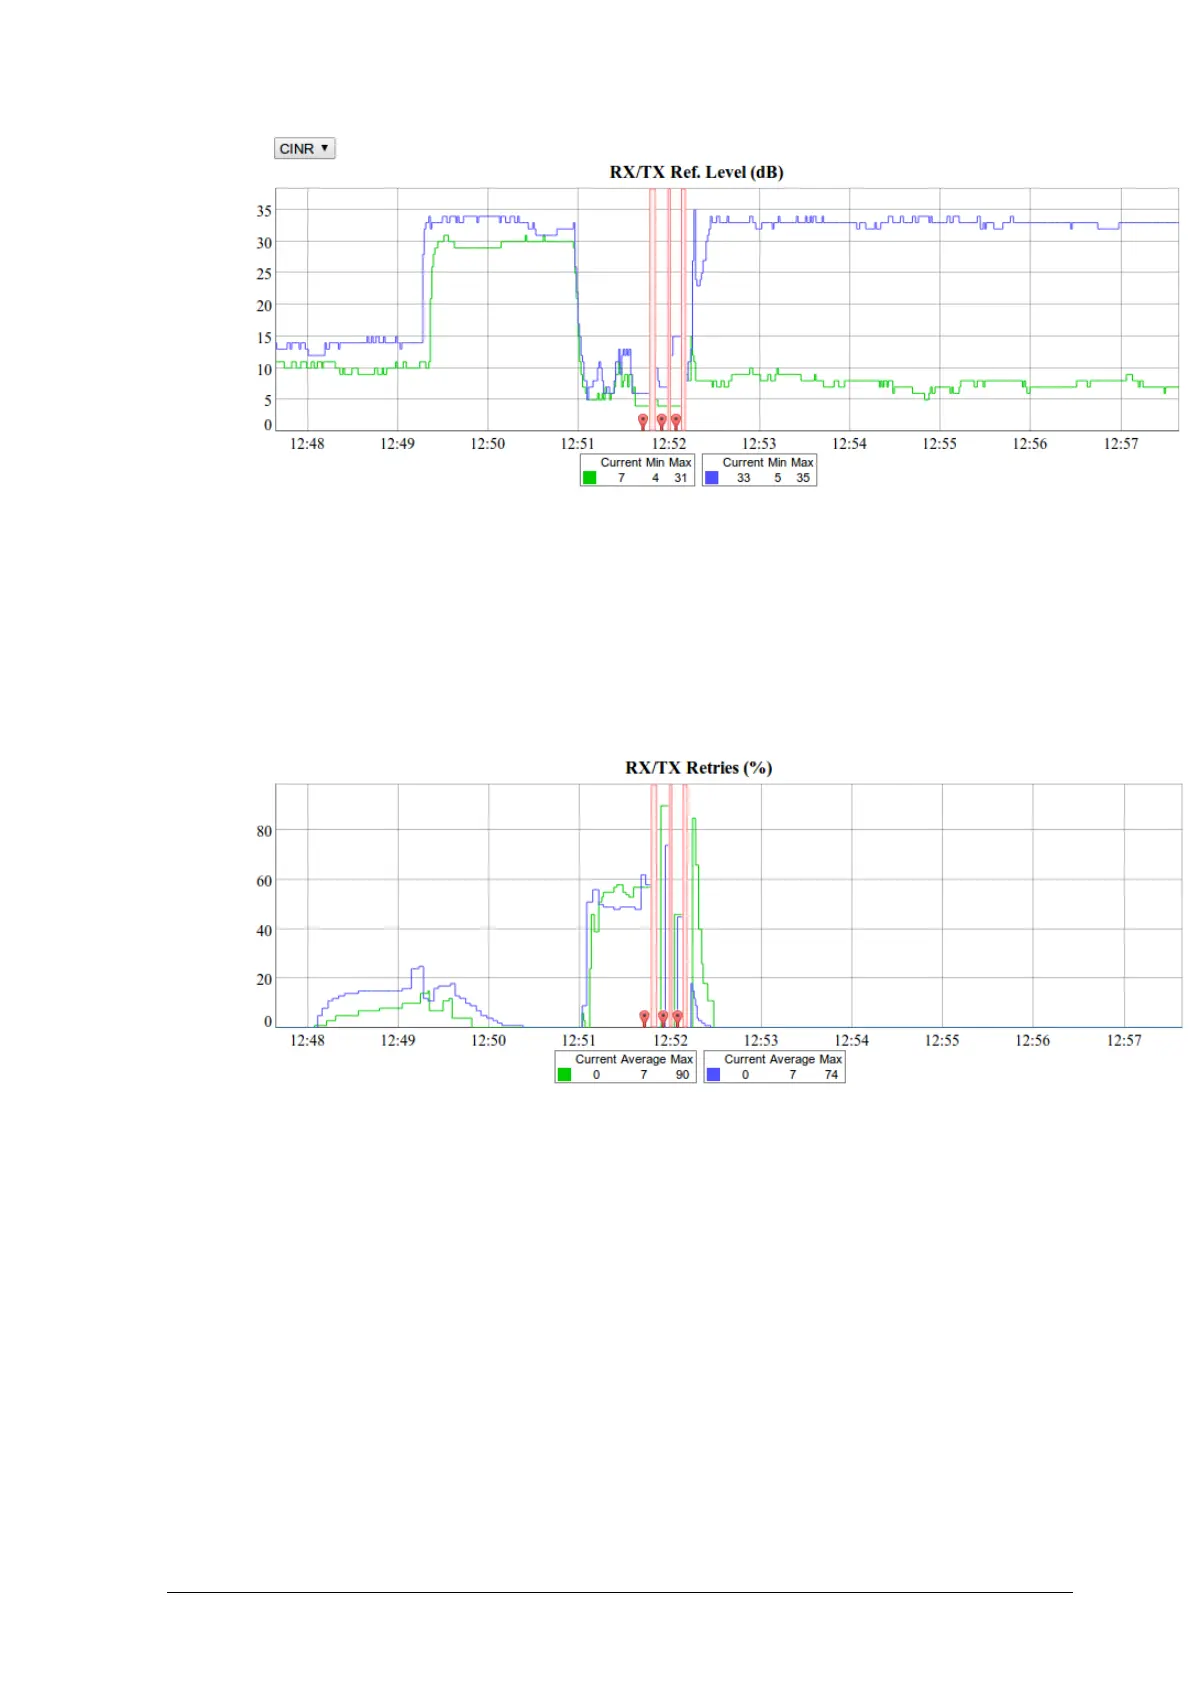
RX/TX Retries (%)
This chart displays retry percentage – an important parameter, that provides a
quick estimation of the link quality. Similar to the previous graphs RX retries are
represented by the green lines, TX retries – by the blue lines and link outages –
by the red lines.
RX/TX Bitrate (Mbps)