12–2 Minimate Pro Operator Manual
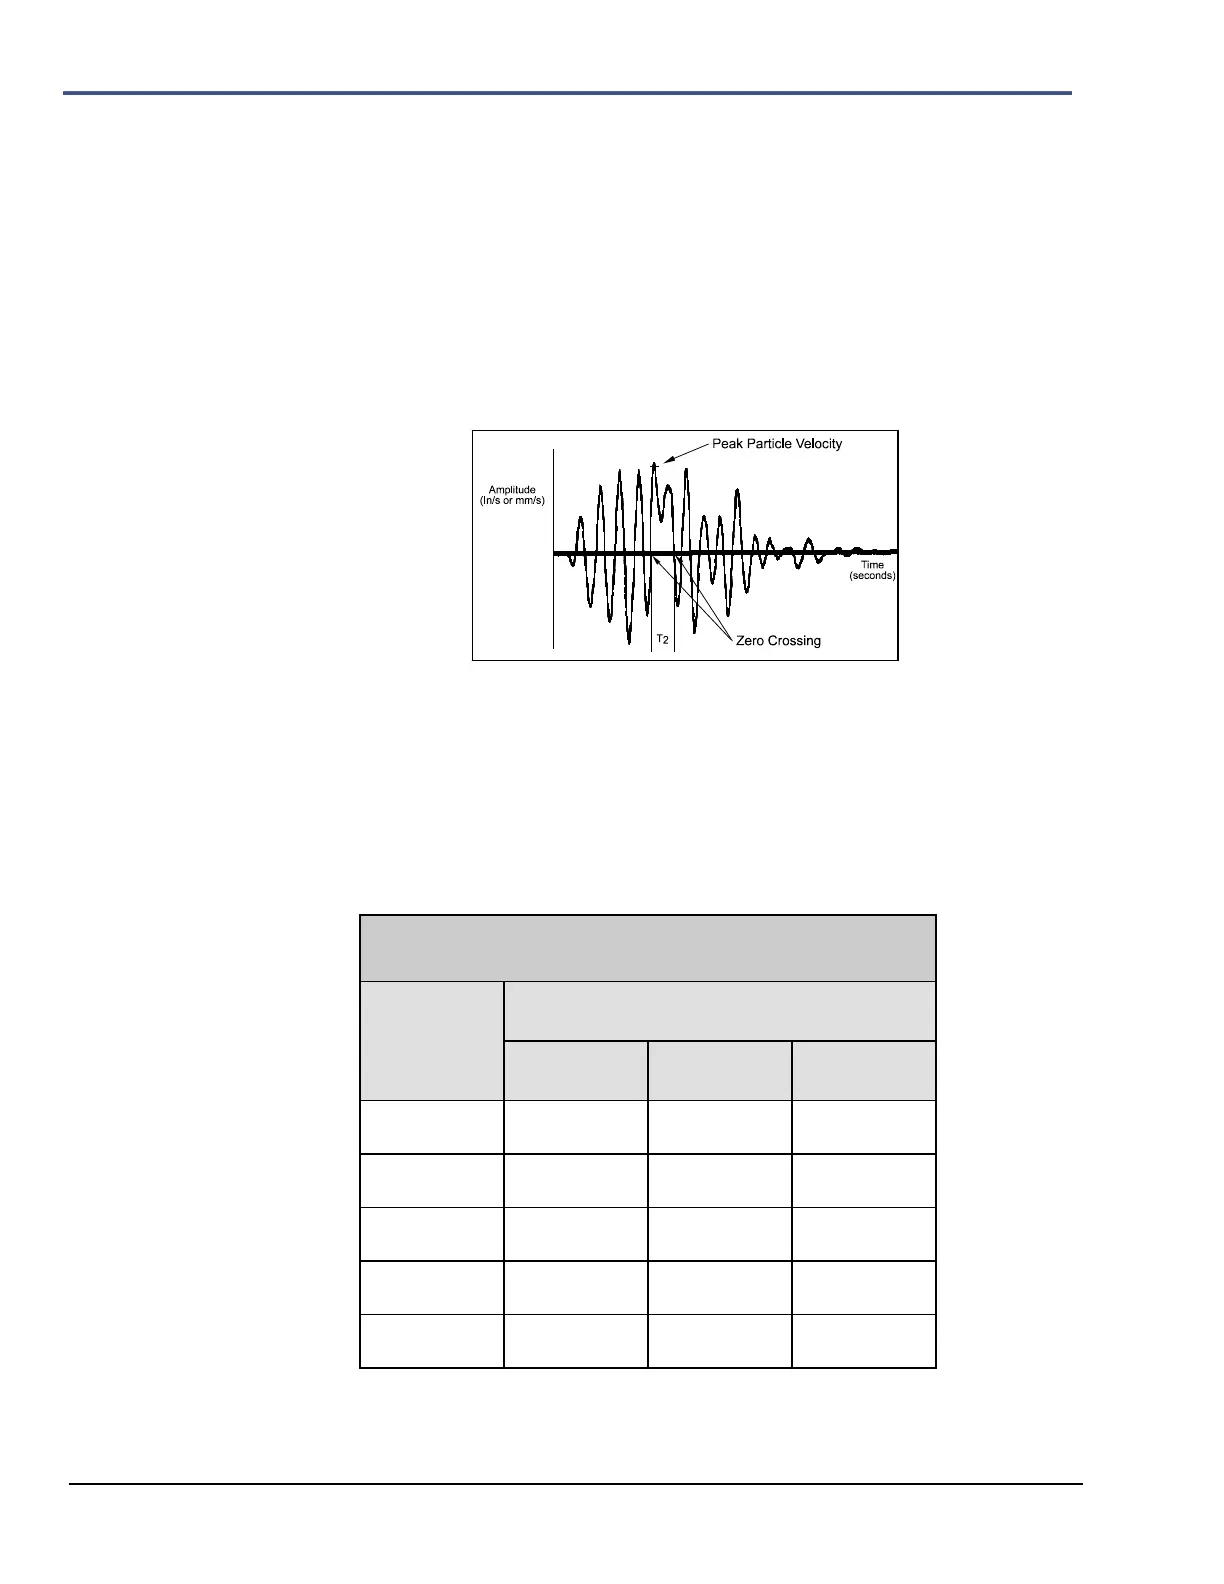
the result of two or more major frequency components representing compound waveforms as
illustrated in the figure below. It is therefore only an approximation of the frequency of the Peak
Particle Velocity.
Waveforms may have the same Peak Particle Velocities but different Zero Crossing Frequencies
depending on the shape of the waveforms involved. With reference to the figures above and
below; both waveforms have the same Peak Particle Velocities however their Zero Crossing
Frequencies differ. In the figure above, the zero crossing frequency uses the 1/2 period indicated
by T
1
. In the figure below, the zero crossing frequency uses the 1/2 period indicated by T
2
. Notice
that T
1
is less than T
2
because of the different waveform shapes, therefore the Zero Crossing
Frequency in figure above is greater than the Zero Crossing Frequency in the figure below. It is for
this reason, the Zero Crossing Frequency may differ for peaks having the same Peak Particle
Velocity.
Zero Crossing Frequency Calculation Limitation
(3) Sample Rate Error
The Zero Crossing Frequency requires the period of a wavelength before it can calculate the
wavelength‟s frequency using the formula 1/period. A sampling error occurs for higher
frequencies when wavelength periods become relatively small and the sampling rate begins to
miss zero crossing points. In other words, the wavelength periods occur much faster than a
Minimate Pro can sample and use in the calculation.
At higher frequencies there are fewer sample points per cycle and therefore greater error. The
following table illustrates how error increases with frequency.
Zero Crossing Frequency Sample Error Rate
The Minimate Pro does not calculate frequencies above 100 Hz because of the high error level at
1024 samples per second. The message ">100 Hz" displays. Furthermore if a waveform is very
 Loading...