www.ioncamera.com EN - 66
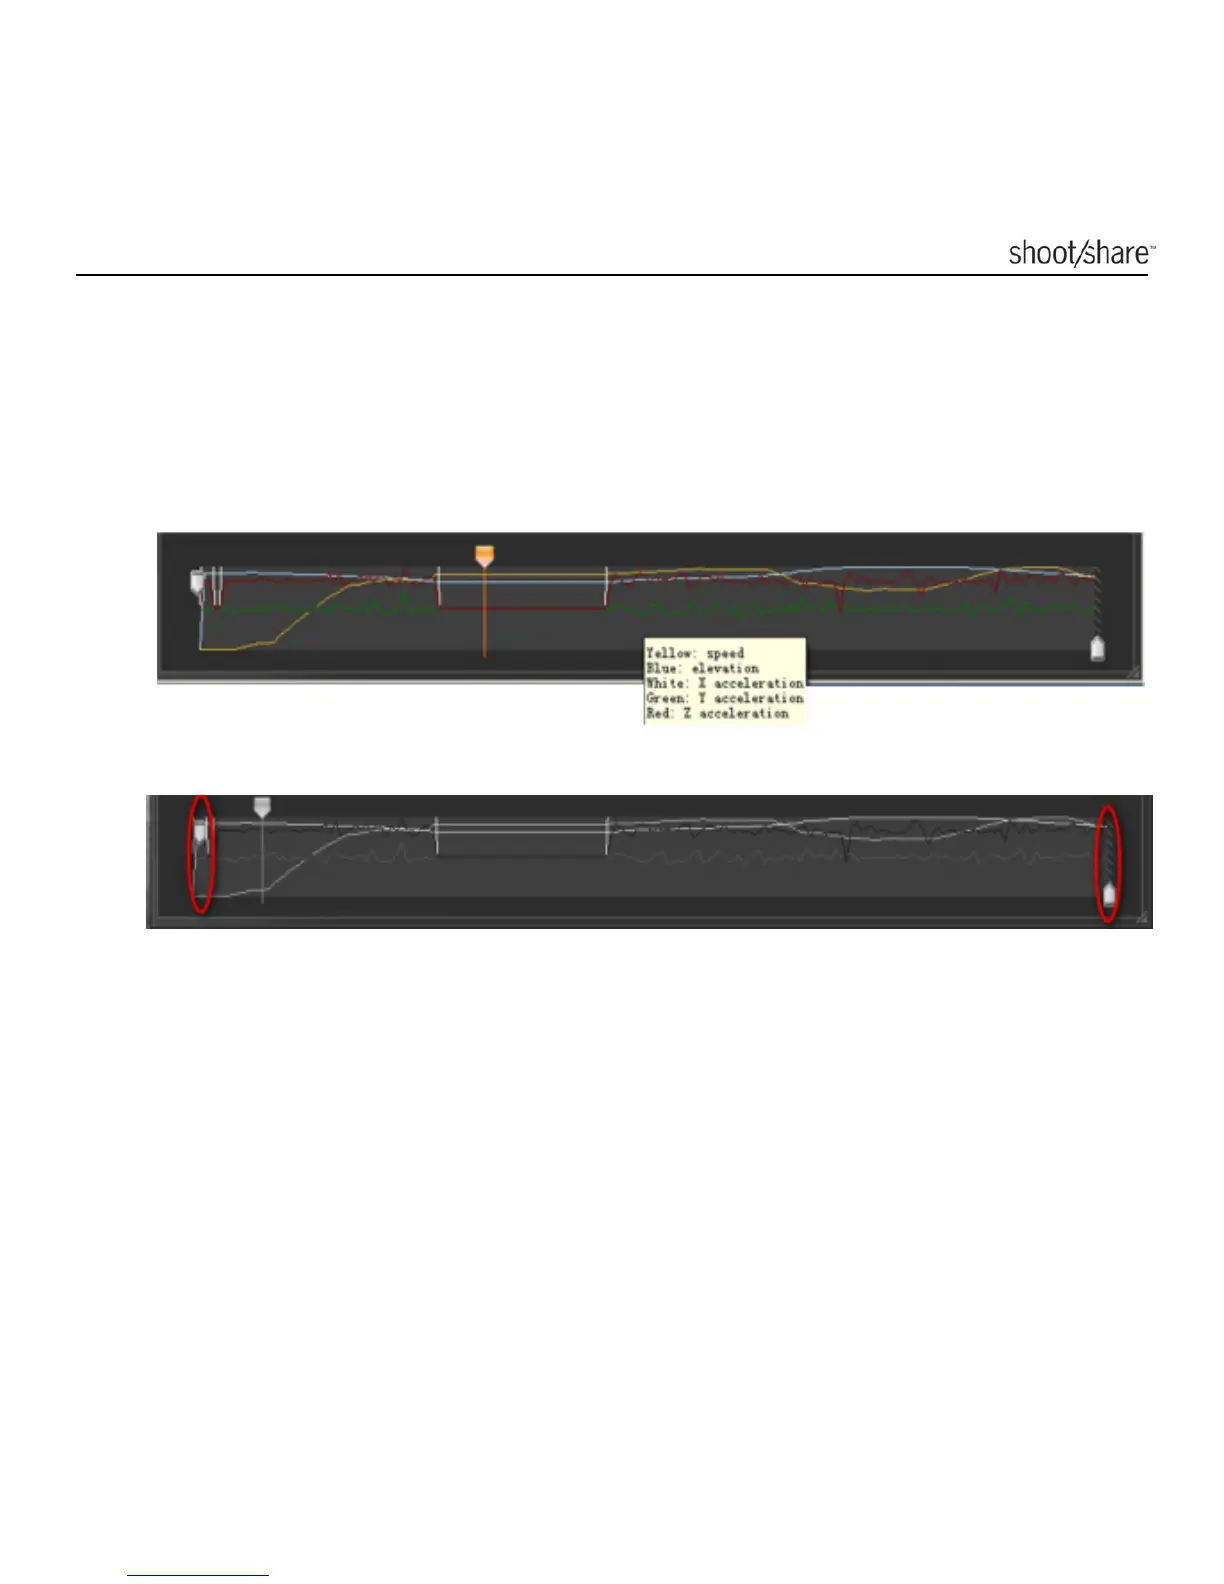
Introduction of the Statistics Chart
When hovering your mouse over the curves in the center section of the chart, a
legend will appear for the chart.
1. The Yellow line represents the speed, Blue line represents the elevation, White
line represent the X acceleration, Green line represents Y acceleration while
the Red line represents the Z acceleration.
2. Select only a part of the video by trimming at the beginning (Start bar) and at
the end (End bar) before uploading the track to the Kinomap website.
3. The grey area in the Statistics chart implies no GPS signal has been recorded
in that video track section.