Page 55 KACO blueplanet 3.0 NX3 M2 KACO blueplanet 5.0 NX3 M2 KACO blueplanet 8.0 NX3 M2 KACO blueplanet 10.0 NX3 M2
KACO blueplanet 15.0 NX3 M2 KACO blueplanet 20.0 NX3 M2
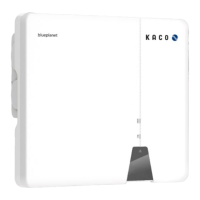
Fig. 139. Diagram comparing the energy requirement of a detached home and PV output
Energy requirement of a detached home
70% feed-in power (yellow area)
70% fixed feed-in limit (grey line)
– regulation command to inverter
Lost feed-in power (red area)
It is evident that there is a constant base load, especially at night (continuous/standby operation of consumers).
Based on this graph, we can now see that the actual self consumption values communicated should result in considerably
less power being lost from the PV system.
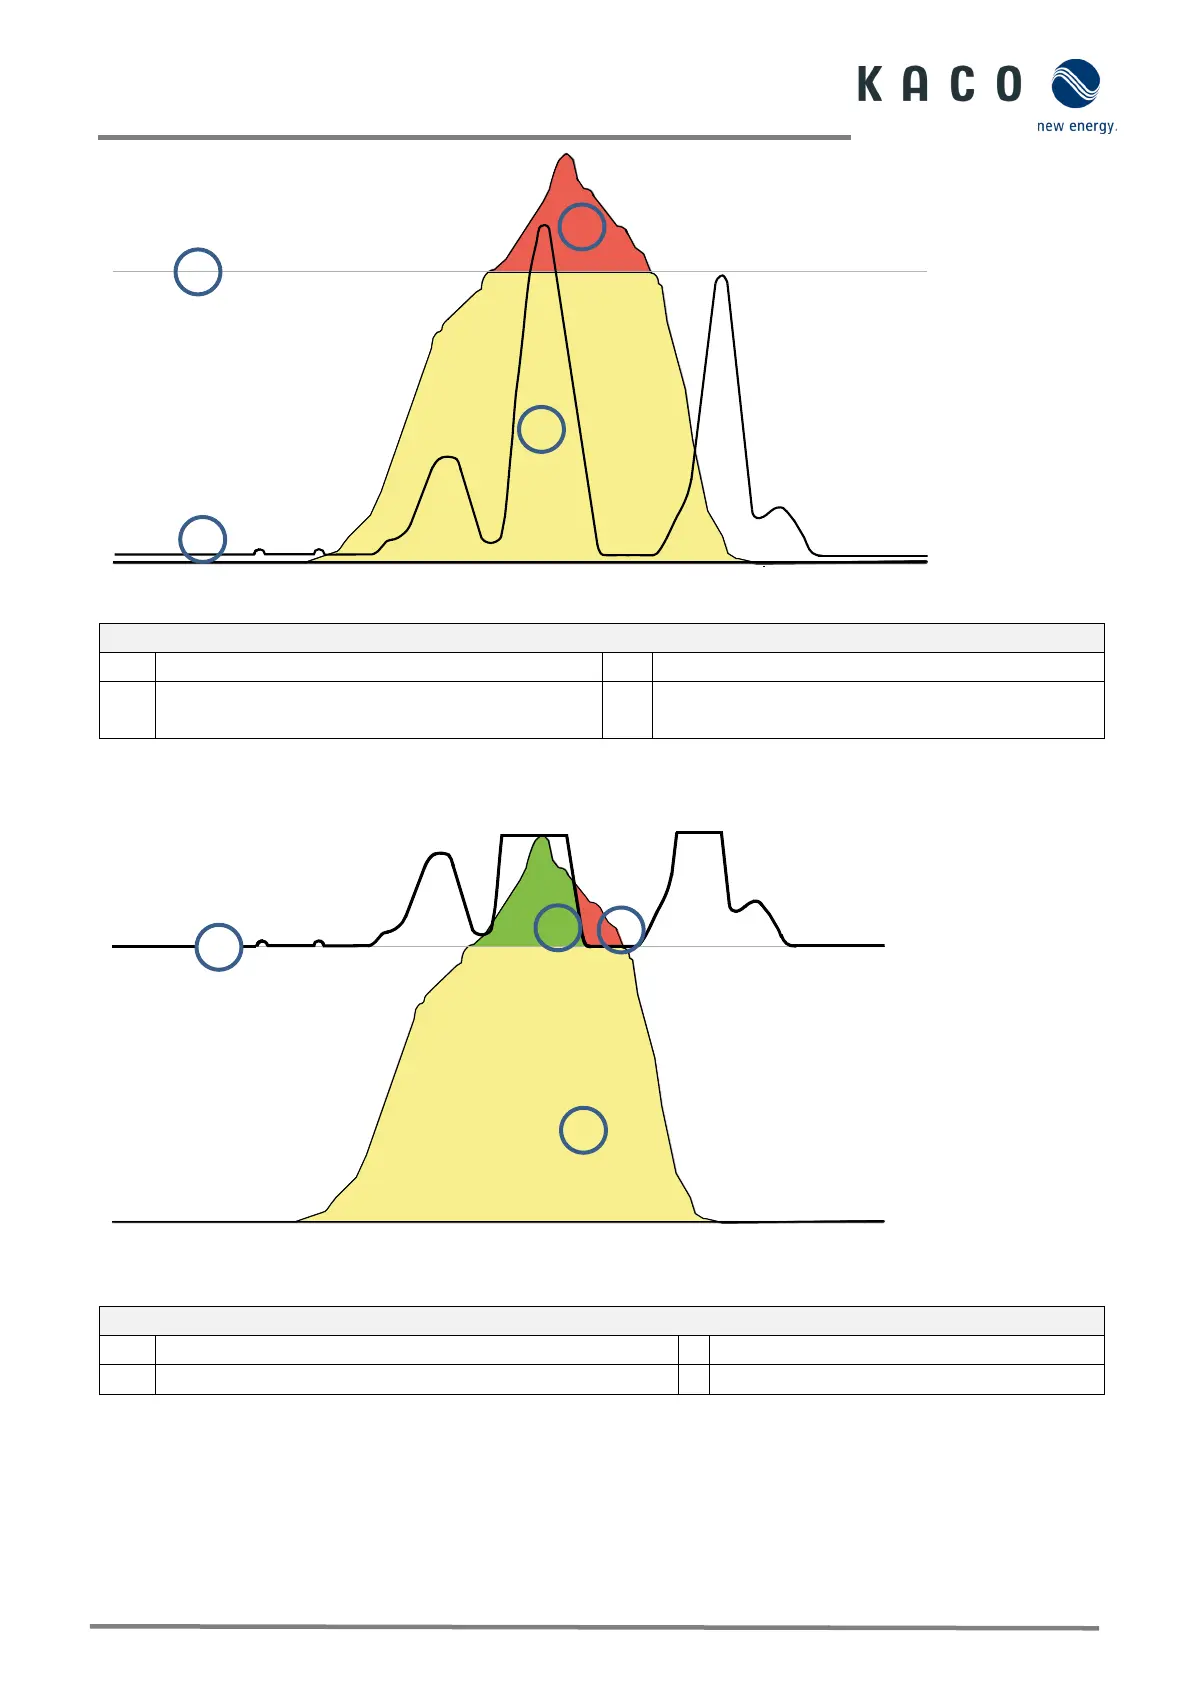
Fig. 140. Diagram of increase in self consumption
Regulation command to device 70% + self consumption
PV power gained through self consumption
Energy requirement of a detached home (green area)
PV power lost despite self consumption
Using the feed-in meter/data logger for calculations allows more efficient use to be made of the PV system, thus providing
more energy for self-consumption.
Graph Fig. 145 also shows that a red area (lost energy) is nevertheless produced because the amount of power consumed
by the owner has fallen to 0 but the PV system could provide more electricity. When the self consumption falls to 0 kW, the
70% regulation function takes effect again.
The 0% feed-in regulation, on the other hand, must ensure that there is no feed into the public grid. Depending on the self
consumption, the PV system output may be connected up in such a way that the user can make use of the energy
generated themselves and nothing has to be purchased from the public grid.
00:00
02:00
04:00
06:00
08:00
10:00
12:00
14:00 16:00 18:00 20:00 22:00 00:00
U
hrzeit [hh
:mm]
00:00
02:00
04:00
06:00 08:00
10:00
12:00
14:00 16:00 18:00 20:00 22:00 00:00
Uhrzeit [hh:m
m]
command to
90
80
70
9
8
7
6
5
4
3
2
1
0
9
8
7
6
5
4
3
2
1
 Loading...